Costa Rican vs Iraqi Householder Income Ages 25 - 44 years
COMPARE
Costa Rican
Iraqi
Householder Income Ages 25 - 44 years
Householder Income Ages 25 - 44 years Comparison
Costa Ricans
Iraqis
$95,565
HOUSEHOLDER INCOME AGES 25 - 44 YEARS
63.5/ 100
METRIC RATING
159th/ 347
METRIC RANK
$90,764
HOUSEHOLDER INCOME AGES 25 - 44 YEARS
10.8/ 100
METRIC RATING
211th/ 347
METRIC RANK
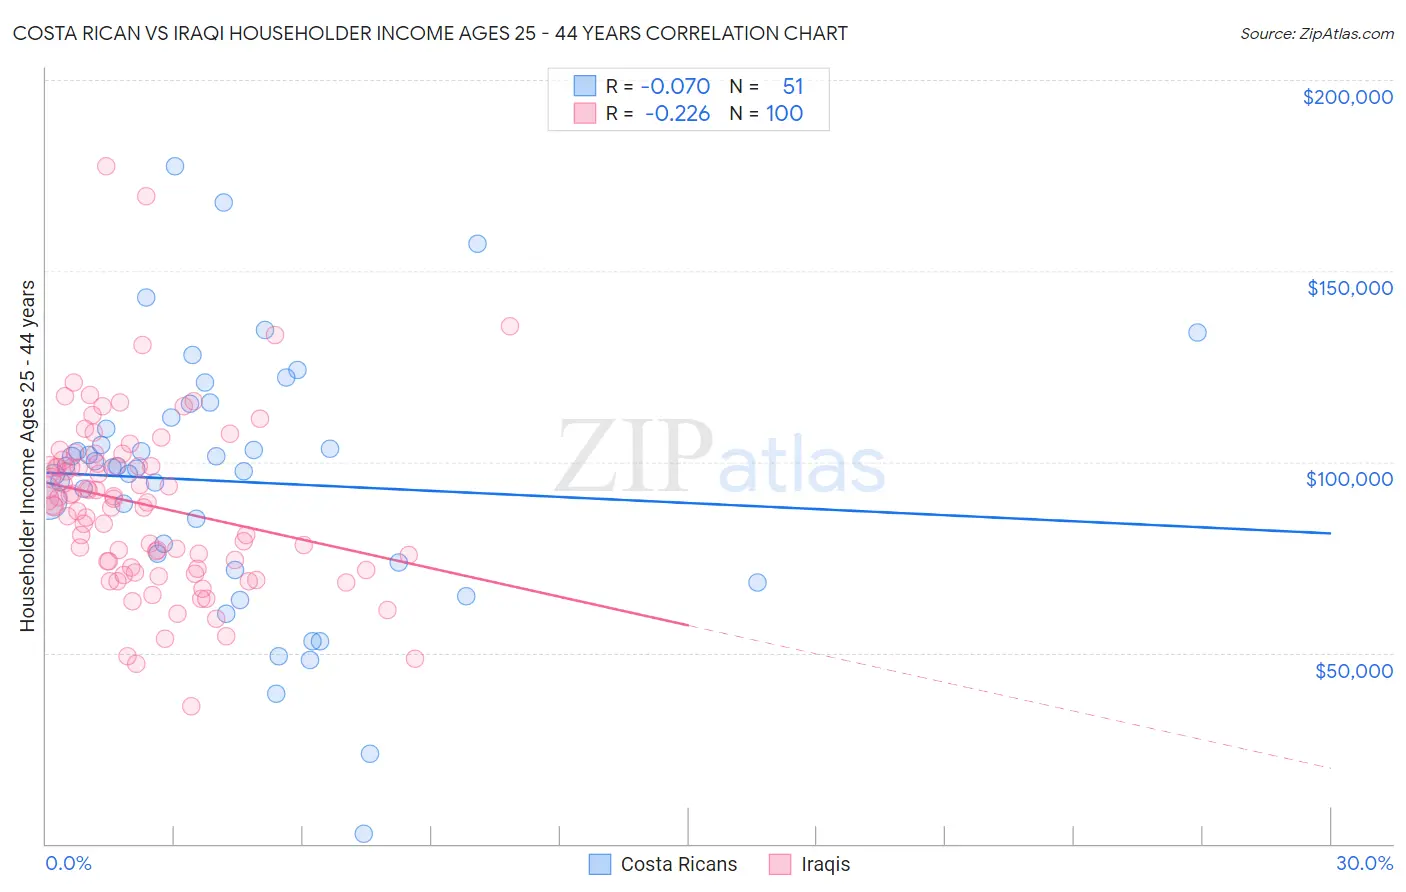
Costa Rican vs Iraqi Householder Income Ages 25 - 44 years Correlation Chart
The statistical analysis conducted on geographies consisting of 253,116,835 people shows a slight negative correlation between the proportion of Costa Ricans and household income with householder between the ages 25 and 44 in the United States with a correlation coefficient (R) of -0.070 and weighted average of $95,565. Similarly, the statistical analysis conducted on geographies consisting of 170,561,402 people shows a weak negative correlation between the proportion of Iraqis and household income with householder between the ages 25 and 44 in the United States with a correlation coefficient (R) of -0.226 and weighted average of $90,764, a difference of 5.3%.
Householder Income Ages 25 - 44 years Correlation Summary
| Measurement | Costa Rican | Iraqi |
| Minimum | $2,499 | $35,938 |
| Maximum | $177,312 | $177,567 |
| Range | $174,813 | $141,629 |
| Mean | $94,845 | $88,687 |
| Median | $98,440 | $88,906 |
| Interquartile 25% (IQ1) | $73,523 | $72,138 |
| Interquartile 75% (IQ3) | $111,609 | $99,186 |
| Interquartile Range (IQR) | $38,086 | $27,048 |
| Standard Deviation (Sample) | $33,692 | $23,025 |
| Standard Deviation (Population) | $33,360 | $22,910 |
Similar Demographics by Householder Income Ages 25 - 44 years
Demographics Similar to Costa Ricans by Householder Income Ages 25 - 44 years
In terms of householder income ages 25 - 44 years, the demographic groups most similar to Costa Ricans are Icelander ($95,560, a difference of 0.010%), Scandinavian ($95,596, a difference of 0.030%), Immigrants from Portugal ($95,512, a difference of 0.060%), Swiss ($95,511, a difference of 0.060%), and Immigrants from Saudi Arabia ($95,450, a difference of 0.12%).
| Demographics | Rating | Rank | Householder Income Ages 25 - 44 years |
| South American Indians | 74.5 /100 | #152 | Good $96,497 |
| Slovenes | 73.9 /100 | #153 | Good $96,439 |
| Slavs | 73.2 /100 | #154 | Good $96,377 |
| Moroccans | 70.3 /100 | #155 | Good $96,117 |
| Immigrants | Germany | 67.9 /100 | #156 | Good $95,913 |
| Immigrants | Uganda | 65.2 /100 | #157 | Good $95,698 |
| Scandinavians | 63.9 /100 | #158 | Good $95,596 |
| Costa Ricans | 63.5 /100 | #159 | Good $95,565 |
| Icelanders | 63.4 /100 | #160 | Good $95,560 |
| Immigrants | Portugal | 62.8 /100 | #161 | Good $95,512 |
| Swiss | 62.8 /100 | #162 | Good $95,511 |
| Immigrants | Saudi Arabia | 62.0 /100 | #163 | Good $95,450 |
| South Americans | 60.9 /100 | #164 | Good $95,362 |
| Immigrants | Nepal | 60.3 /100 | #165 | Good $95,322 |
| Immigrants | Ethiopia | 59.5 /100 | #166 | Average $95,256 |
Demographics Similar to Iraqis by Householder Income Ages 25 - 44 years
In terms of householder income ages 25 - 44 years, the demographic groups most similar to Iraqis are Immigrants from Kenya ($90,767, a difference of 0.0%), Hawaiian ($90,722, a difference of 0.050%), Immigrants from Bangladesh ($90,448, a difference of 0.35%), Immigrants from Africa ($90,372, a difference of 0.43%), and Immigrants from Uruguay ($91,171, a difference of 0.45%).
| Demographics | Rating | Rank | Householder Income Ages 25 - 44 years |
| Nepalese | 15.4 /100 | #204 | Poor $91,498 |
| Immigrants | Eastern Africa | 15.2 /100 | #205 | Poor $91,458 |
| Aleuts | 14.5 /100 | #206 | Poor $91,370 |
| Yugoslavians | 14.5 /100 | #207 | Poor $91,368 |
| Immigrants | Thailand | 14.3 /100 | #208 | Poor $91,337 |
| Immigrants | Uruguay | 13.2 /100 | #209 | Poor $91,171 |
| Immigrants | Kenya | 10.9 /100 | #210 | Poor $90,767 |
| Iraqis | 10.8 /100 | #211 | Poor $90,764 |
| Hawaiians | 10.6 /100 | #212 | Poor $90,722 |
| Immigrants | Bangladesh | 9.3 /100 | #213 | Tragic $90,448 |
| Immigrants | Africa | 8.9 /100 | #214 | Tragic $90,372 |
| Panamanians | 8.1 /100 | #215 | Tragic $90,193 |
| Ghanaians | 7.9 /100 | #216 | Tragic $90,137 |
| Scotch-Irish | 7.3 /100 | #217 | Tragic $89,969 |
| Guyanese | 7.1 /100 | #218 | Tragic $89,940 |