Costa Rican vs Belizean Householder Income Ages 25 - 44 years
COMPARE
Costa Rican
Belizean
Householder Income Ages 25 - 44 years
Householder Income Ages 25 - 44 years Comparison
Costa Ricans
Belizeans
$95,565
HOUSEHOLDER INCOME AGES 25 - 44 YEARS
63.5/ 100
METRIC RATING
159th/ 347
METRIC RANK
$84,534
HOUSEHOLDER INCOME AGES 25 - 44 YEARS
0.4/ 100
METRIC RATING
263rd/ 347
METRIC RANK
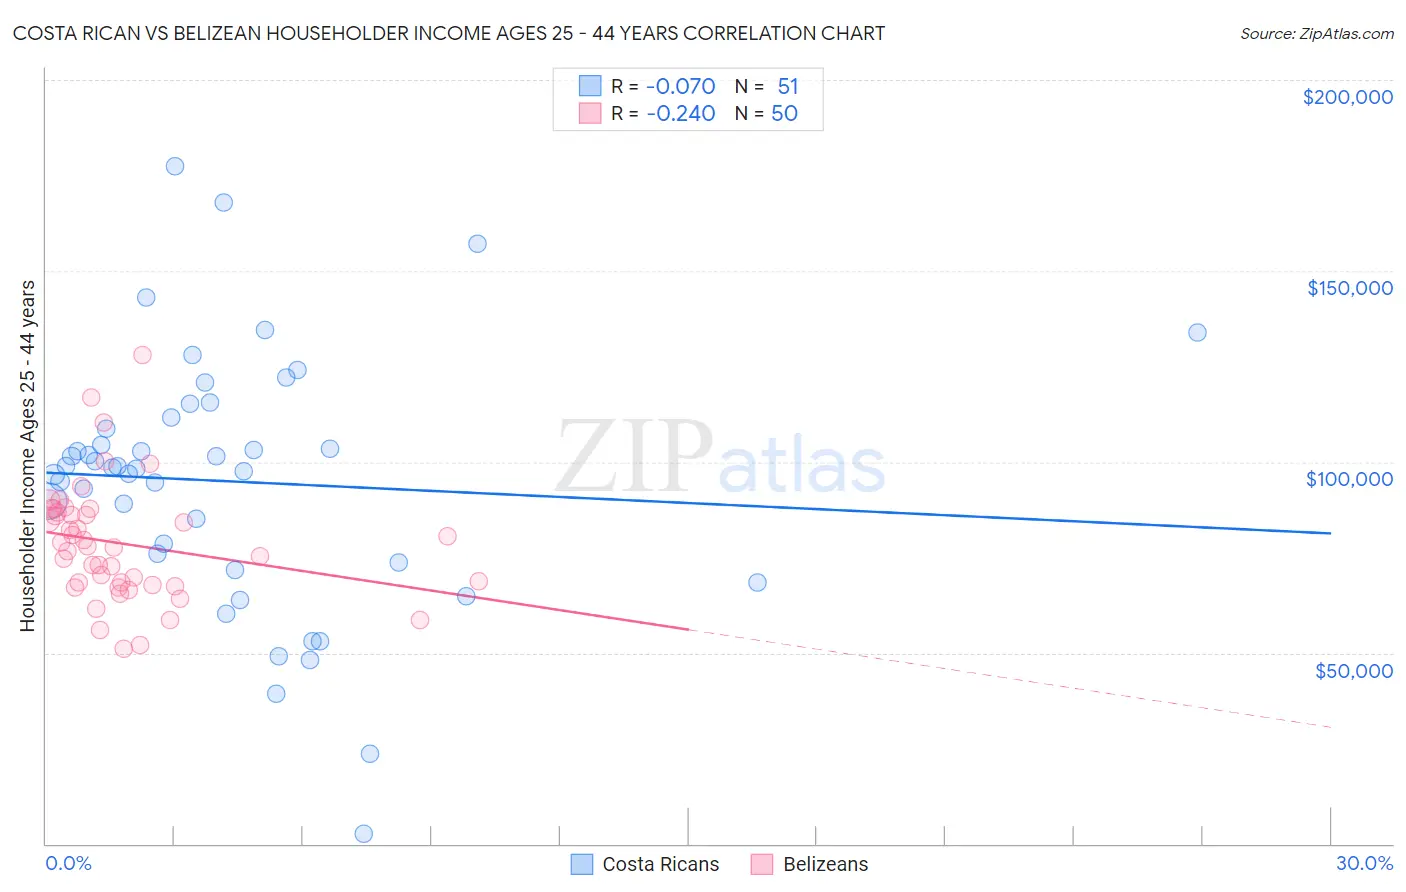
Costa Rican vs Belizean Householder Income Ages 25 - 44 years Correlation Chart
The statistical analysis conducted on geographies consisting of 253,116,835 people shows a slight negative correlation between the proportion of Costa Ricans and household income with householder between the ages 25 and 44 in the United States with a correlation coefficient (R) of -0.070 and weighted average of $95,565. Similarly, the statistical analysis conducted on geographies consisting of 144,109,917 people shows a weak negative correlation between the proportion of Belizeans and household income with householder between the ages 25 and 44 in the United States with a correlation coefficient (R) of -0.240 and weighted average of $84,534, a difference of 13.1%.
Householder Income Ages 25 - 44 years Correlation Summary
| Measurement | Costa Rican | Belizean |
| Minimum | $2,499 | $50,928 |
| Maximum | $177,312 | $128,125 |
| Range | $174,813 | $77,197 |
| Mean | $94,845 | $78,550 |
| Median | $98,440 | $77,650 |
| Interquartile 25% (IQ1) | $73,523 | $67,791 |
| Interquartile 75% (IQ3) | $111,609 | $86,760 |
| Interquartile Range (IQR) | $38,086 | $18,970 |
| Standard Deviation (Sample) | $33,692 | $15,455 |
| Standard Deviation (Population) | $33,360 | $15,299 |
Similar Demographics by Householder Income Ages 25 - 44 years
Demographics Similar to Costa Ricans by Householder Income Ages 25 - 44 years
In terms of householder income ages 25 - 44 years, the demographic groups most similar to Costa Ricans are Icelander ($95,560, a difference of 0.010%), Scandinavian ($95,596, a difference of 0.030%), Immigrants from Portugal ($95,512, a difference of 0.060%), Swiss ($95,511, a difference of 0.060%), and Immigrants from Saudi Arabia ($95,450, a difference of 0.12%).
| Demographics | Rating | Rank | Householder Income Ages 25 - 44 years |
| South American Indians | 74.5 /100 | #152 | Good $96,497 |
| Slovenes | 73.9 /100 | #153 | Good $96,439 |
| Slavs | 73.2 /100 | #154 | Good $96,377 |
| Moroccans | 70.3 /100 | #155 | Good $96,117 |
| Immigrants | Germany | 67.9 /100 | #156 | Good $95,913 |
| Immigrants | Uganda | 65.2 /100 | #157 | Good $95,698 |
| Scandinavians | 63.9 /100 | #158 | Good $95,596 |
| Costa Ricans | 63.5 /100 | #159 | Good $95,565 |
| Icelanders | 63.4 /100 | #160 | Good $95,560 |
| Immigrants | Portugal | 62.8 /100 | #161 | Good $95,512 |
| Swiss | 62.8 /100 | #162 | Good $95,511 |
| Immigrants | Saudi Arabia | 62.0 /100 | #163 | Good $95,450 |
| South Americans | 60.9 /100 | #164 | Good $95,362 |
| Immigrants | Nepal | 60.3 /100 | #165 | Good $95,322 |
| Immigrants | Ethiopia | 59.5 /100 | #166 | Average $95,256 |
Demographics Similar to Belizeans by Householder Income Ages 25 - 44 years
In terms of householder income ages 25 - 44 years, the demographic groups most similar to Belizeans are Cree ($84,574, a difference of 0.050%), Osage ($84,461, a difference of 0.090%), Inupiat ($84,619, a difference of 0.10%), Sudanese ($84,401, a difference of 0.16%), and Immigrants from Cabo Verde ($84,304, a difference of 0.27%).
| Demographics | Rating | Rank | Householder Income Ages 25 - 44 years |
| Central Americans | 0.5 /100 | #256 | Tragic $85,144 |
| Mexican American Indians | 0.5 /100 | #257 | Tragic $85,066 |
| Immigrants | Nicaragua | 0.5 /100 | #258 | Tragic $84,914 |
| Immigrants | Senegal | 0.5 /100 | #259 | Tragic $84,848 |
| Americans | 0.4 /100 | #260 | Tragic $84,791 |
| Inupiat | 0.4 /100 | #261 | Tragic $84,619 |
| Cree | 0.4 /100 | #262 | Tragic $84,574 |
| Belizeans | 0.4 /100 | #263 | Tragic $84,534 |
| Osage | 0.4 /100 | #264 | Tragic $84,461 |
| Sudanese | 0.4 /100 | #265 | Tragic $84,401 |
| Immigrants | Cabo Verde | 0.3 /100 | #266 | Tragic $84,304 |
| Hmong | 0.3 /100 | #267 | Tragic $84,258 |
| Sub-Saharan Africans | 0.3 /100 | #268 | Tragic $84,235 |
| Spanish American Indians | 0.3 /100 | #269 | Tragic $84,085 |
| Jamaicans | 0.3 /100 | #270 | Tragic $83,933 |