Costa Rican vs Czechoslovakian 8th Grade
COMPARE
Costa Rican
Czechoslovakian
8th Grade
8th Grade Comparison
Costa Ricans
Czechoslovakians
95.2%
8TH GRADE
3.0/ 100
METRIC RATING
234th/ 347
METRIC RANK
96.9%
8TH GRADE
99.9/ 100
METRIC RATING
46th/ 347
METRIC RANK
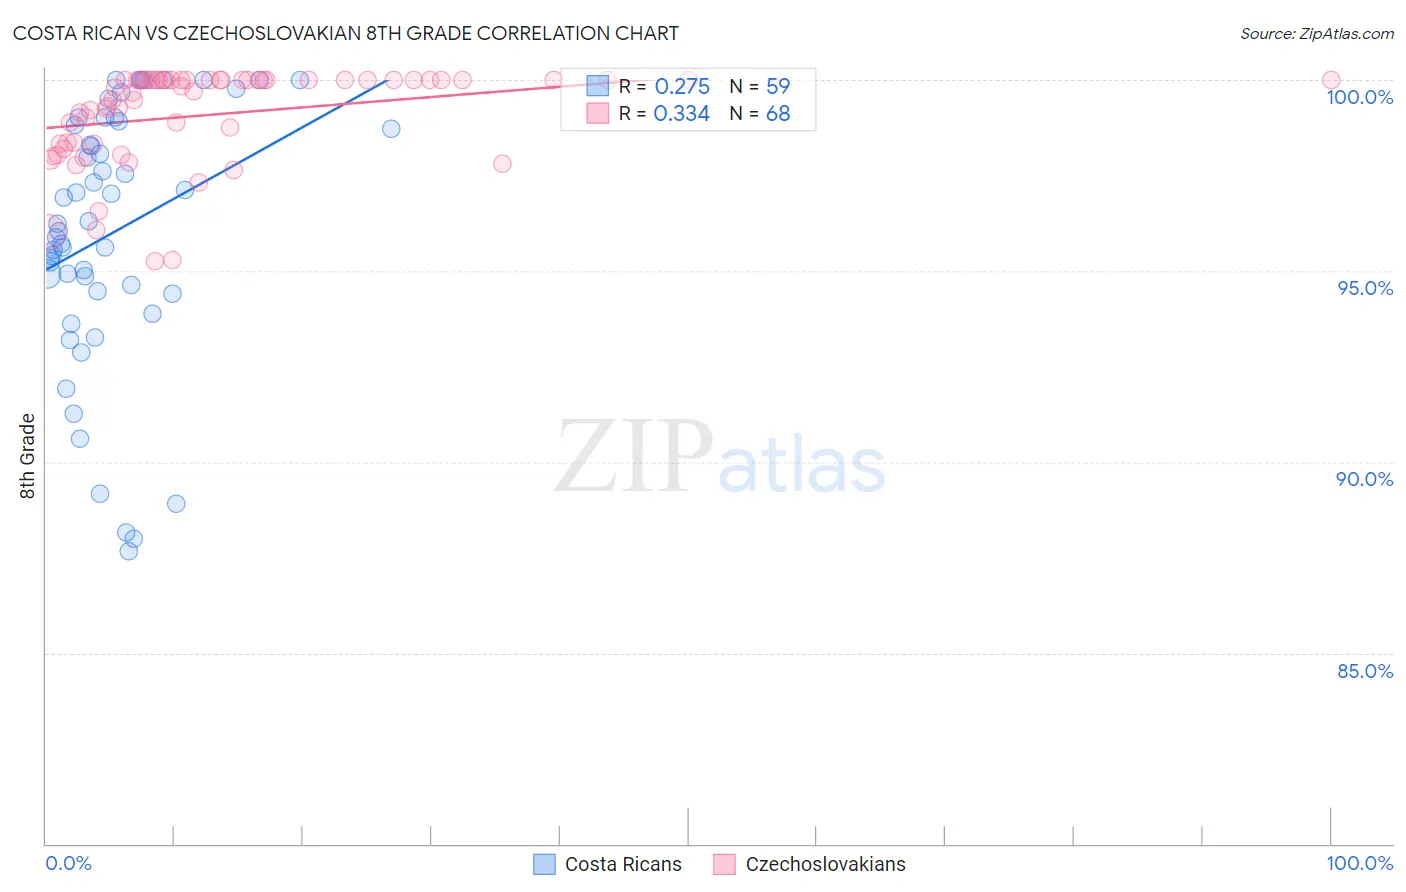
Costa Rican vs Czechoslovakian 8th Grade Correlation Chart
The statistical analysis conducted on geographies consisting of 253,601,897 people shows a weak positive correlation between the proportion of Costa Ricans and percentage of population with at least 8th grade education in the United States with a correlation coefficient (R) of 0.275 and weighted average of 95.2%. Similarly, the statistical analysis conducted on geographies consisting of 368,657,544 people shows a mild positive correlation between the proportion of Czechoslovakians and percentage of population with at least 8th grade education in the United States with a correlation coefficient (R) of 0.334 and weighted average of 96.9%, a difference of 1.8%.
8th Grade Correlation Summary
| Measurement | Costa Rican | Czechoslovakian |
| Minimum | 87.6% | 95.3% |
| Maximum | 100.0% | 100.0% |
| Range | 12.4% | 4.7% |
| Mean | 96.0% | 99.1% |
| Median | 96.2% | 99.8% |
| Interquartile 25% (IQ1) | 94.5% | 98.3% |
| Interquartile 75% (IQ3) | 98.9% | 100.0% |
| Interquartile Range (IQR) | 4.5% | 1.7% |
| Standard Deviation (Sample) | 3.4% | 1.2% |
| Standard Deviation (Population) | 3.3% | 1.2% |
Similar Demographics by 8th Grade
Demographics Similar to Costa Ricans by 8th Grade
In terms of 8th grade, the demographic groups most similar to Costa Ricans are Immigrants from Asia (95.2%, a difference of 0.0%), Nigerian (95.2%, a difference of 0.010%), Asian (95.2%, a difference of 0.020%), Indian (Asian) (95.2%, a difference of 0.020%), and Senegalese (95.2%, a difference of 0.020%).
| Demographics | Rating | Rank | 8th Grade |
| Bahamians | 5.6 /100 | #227 | Tragic 95.3% |
| Immigrants | Eastern Africa | 5.6 /100 | #228 | Tragic 95.3% |
| Immigrants | Indonesia | 4.4 /100 | #229 | Tragic 95.3% |
| Immigrants | Panama | 4.1 /100 | #230 | Tragic 95.2% |
| Asians | 3.5 /100 | #231 | Tragic 95.2% |
| Indians (Asian) | 3.3 /100 | #232 | Tragic 95.2% |
| Immigrants | Asia | 3.1 /100 | #233 | Tragic 95.2% |
| Costa Ricans | 3.0 /100 | #234 | Tragic 95.2% |
| Nigerians | 2.9 /100 | #235 | Tragic 95.2% |
| Senegalese | 2.7 /100 | #236 | Tragic 95.2% |
| Immigrants | Africa | 2.7 /100 | #237 | Tragic 95.2% |
| Natives/Alaskans | 2.3 /100 | #238 | Tragic 95.2% |
| Immigrants | Sierra Leone | 2.1 /100 | #239 | Tragic 95.1% |
| Ethiopians | 2.0 /100 | #240 | Tragic 95.1% |
| South American Indians | 1.9 /100 | #241 | Tragic 95.1% |
Demographics Similar to Czechoslovakians by 8th Grade
In terms of 8th grade, the demographic groups most similar to Czechoslovakians are Maltese (96.9%, a difference of 0.010%), Northern European (96.9%, a difference of 0.010%), Bulgarian (96.9%, a difference of 0.010%), Aleut (96.9%, a difference of 0.030%), and Slavic (96.8%, a difference of 0.040%).
| Demographics | Rating | Rank | 8th Grade |
| Hungarians | 100.0 /100 | #39 | Exceptional 97.0% |
| Inupiat | 100.0 /100 | #40 | Exceptional 97.0% |
| Eastern Europeans | 100.0 /100 | #41 | Exceptional 97.0% |
| Chinese | 100.0 /100 | #42 | Exceptional 96.9% |
| Aleuts | 99.9 /100 | #43 | Exceptional 96.9% |
| Maltese | 99.9 /100 | #44 | Exceptional 96.9% |
| Northern Europeans | 99.9 /100 | #45 | Exceptional 96.9% |
| Czechoslovakians | 99.9 /100 | #46 | Exceptional 96.9% |
| Bulgarians | 99.9 /100 | #47 | Exceptional 96.9% |
| Slavs | 99.9 /100 | #48 | Exceptional 96.8% |
| Estonians | 99.9 /100 | #49 | Exceptional 96.8% |
| Immigrants | Scotland | 99.9 /100 | #50 | Exceptional 96.8% |
| Celtics | 99.9 /100 | #51 | Exceptional 96.8% |
| Greeks | 99.9 /100 | #52 | Exceptional 96.8% |
| Austrians | 99.9 /100 | #53 | Exceptional 96.7% |