Comanche vs Spaniard Disability Age 18 to 34
COMPARE
Comanche
Spaniard
Disability Age 18 to 34
Disability Age 18 to 34 Comparison
Comanche
Spaniards
8.3%
DISABILITY AGE 18 TO 34
0.0/ 100
METRIC RATING
331st/ 347
METRIC RANK
7.2%
DISABILITY AGE 18 TO 34
0.6/ 100
METRIC RATING
251st/ 347
METRIC RANK
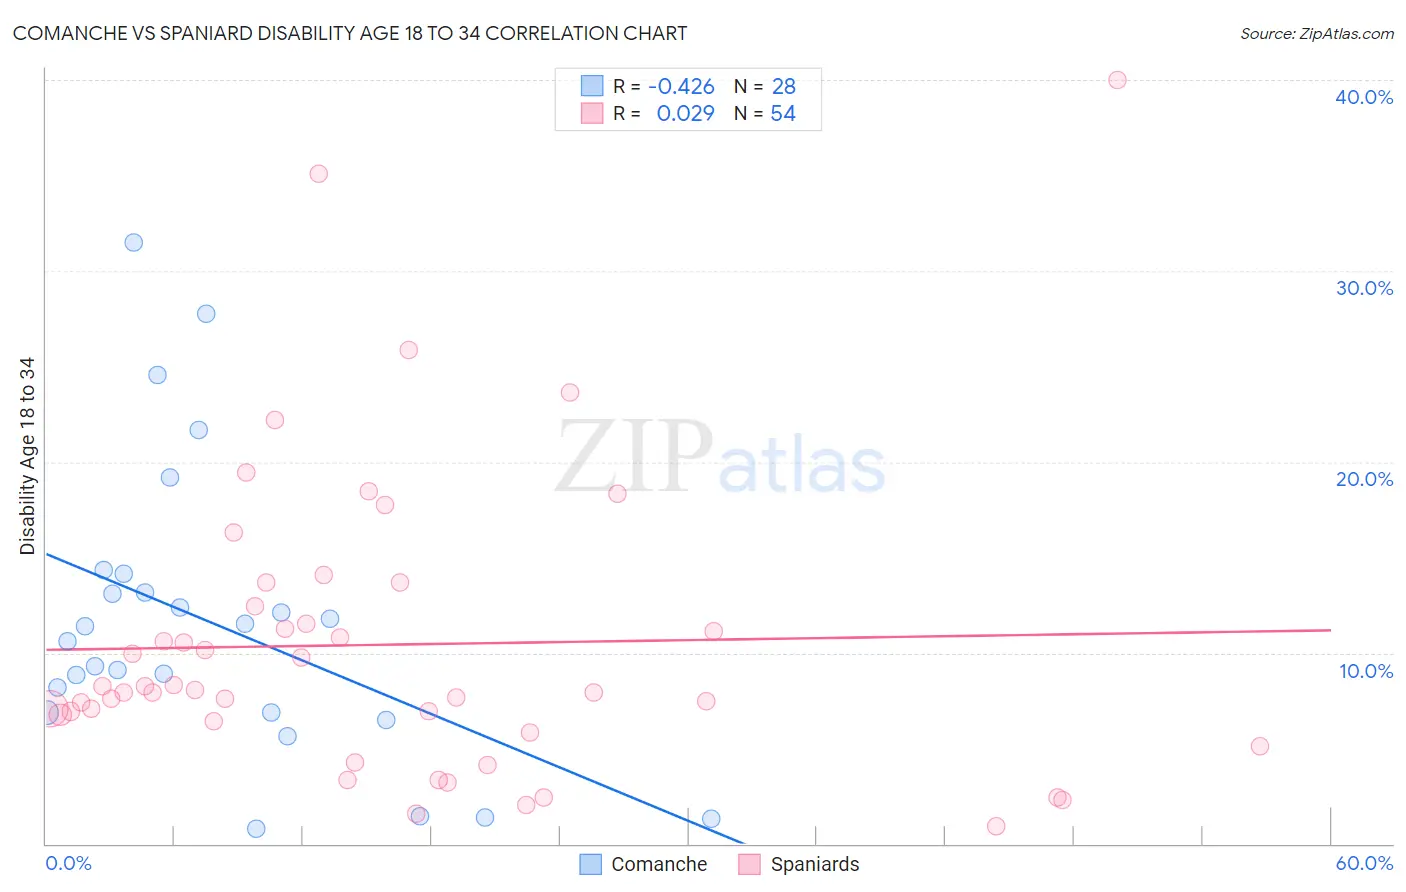
Comanche vs Spaniard Disability Age 18 to 34 Correlation Chart
The statistical analysis conducted on geographies consisting of 109,716,661 people shows a moderate negative correlation between the proportion of Comanche and percentage of population with a disability between the ages 18 and 35 in the United States with a correlation coefficient (R) of -0.426 and weighted average of 8.3%. Similarly, the statistical analysis conducted on geographies consisting of 442,161,812 people shows no correlation between the proportion of Spaniards and percentage of population with a disability between the ages 18 and 35 in the United States with a correlation coefficient (R) of 0.029 and weighted average of 7.2%, a difference of 15.6%.
Disability Age 18 to 34 Correlation Summary
| Measurement | Comanche | Spaniard |
| Minimum | 0.77% | 0.88% |
| Maximum | 31.5% | 40.0% |
| Range | 30.7% | 39.1% |
| Mean | 11.6% | 10.4% |
| Median | 11.0% | 8.0% |
| Interquartile 25% (IQ1) | 6.9% | 6.4% |
| Interquartile 75% (IQ3) | 13.6% | 12.4% |
| Interquartile Range (IQR) | 6.8% | 6.0% |
| Standard Deviation (Sample) | 7.6% | 7.8% |
| Standard Deviation (Population) | 7.5% | 7.7% |
Similar Demographics by Disability Age 18 to 34
Demographics Similar to Comanche by Disability Age 18 to 34
In terms of disability age 18 to 34, the demographic groups most similar to Comanche are Osage (8.3%, a difference of 0.18%), Puget Sound Salish (8.3%, a difference of 0.22%), Crow (8.3%, a difference of 0.44%), Delaware (8.2%, a difference of 0.96%), and Sioux (8.2%, a difference of 1.0%).
| Demographics | Rating | Rank | Disability Age 18 to 34 |
| Cajuns | 0.0 /100 | #324 | Tragic 8.2% |
| Natives/Alaskans | 0.0 /100 | #325 | Tragic 8.2% |
| Potawatomi | 0.0 /100 | #326 | Tragic 8.2% |
| Sioux | 0.0 /100 | #327 | Tragic 8.2% |
| Delaware | 0.0 /100 | #328 | Tragic 8.2% |
| Crow | 0.0 /100 | #329 | Tragic 8.3% |
| Osage | 0.0 /100 | #330 | Tragic 8.3% |
| Comanche | 0.0 /100 | #331 | Tragic 8.3% |
| Puget Sound Salish | 0.0 /100 | #332 | Tragic 8.3% |
| Apache | 0.0 /100 | #333 | Tragic 8.4% |
| Dutch West Indians | 0.0 /100 | #334 | Tragic 8.4% |
| Seminole | 0.0 /100 | #335 | Tragic 8.4% |
| Immigrants | Azores | 0.0 /100 | #336 | Tragic 8.5% |
| Ottawa | 0.0 /100 | #337 | Tragic 8.6% |
| Cherokee | 0.0 /100 | #338 | Tragic 8.7% |
Demographics Similar to Spaniards by Disability Age 18 to 34
In terms of disability age 18 to 34, the demographic groups most similar to Spaniards are Fijian (7.2%, a difference of 0.010%), Polish (7.2%, a difference of 0.020%), Croatian (7.2%, a difference of 0.28%), Malaysian (7.2%, a difference of 0.31%), and Guamanian/Chamorro (7.2%, a difference of 0.41%).
| Demographics | Rating | Rank | Disability Age 18 to 34 |
| Immigrants | Zaire | 0.9 /100 | #244 | Tragic 7.1% |
| Hungarians | 0.9 /100 | #245 | Tragic 7.1% |
| Immigrants | Liberia | 0.8 /100 | #246 | Tragic 7.1% |
| Yugoslavians | 0.8 /100 | #247 | Tragic 7.2% |
| Guamanians/Chamorros | 0.8 /100 | #248 | Tragic 7.2% |
| Malaysians | 0.7 /100 | #249 | Tragic 7.2% |
| Fijians | 0.6 /100 | #250 | Tragic 7.2% |
| Spaniards | 0.6 /100 | #251 | Tragic 7.2% |
| Poles | 0.6 /100 | #252 | Tragic 7.2% |
| Croatians | 0.5 /100 | #253 | Tragic 7.2% |
| Indonesians | 0.4 /100 | #254 | Tragic 7.2% |
| Immigrants | Germany | 0.4 /100 | #255 | Tragic 7.2% |
| Immigrants | Laos | 0.4 /100 | #256 | Tragic 7.2% |
| Czechs | 0.3 /100 | #257 | Tragic 7.2% |
| Immigrants | Micronesia | 0.3 /100 | #258 | Tragic 7.3% |