Scandinavian vs Tsimshian Median Household Income
COMPARE
Scandinavian
Tsimshian
Median Household Income
Median Household Income Comparison
Scandinavians
Tsimshian
$86,073
MEDIAN HOUSEHOLD INCOME
65.1/ 100
METRIC RATING
166th/ 347
METRIC RANK
$83,346
MEDIAN HOUSEHOLD INCOME
24.5/ 100
METRIC RATING
200th/ 347
METRIC RANK
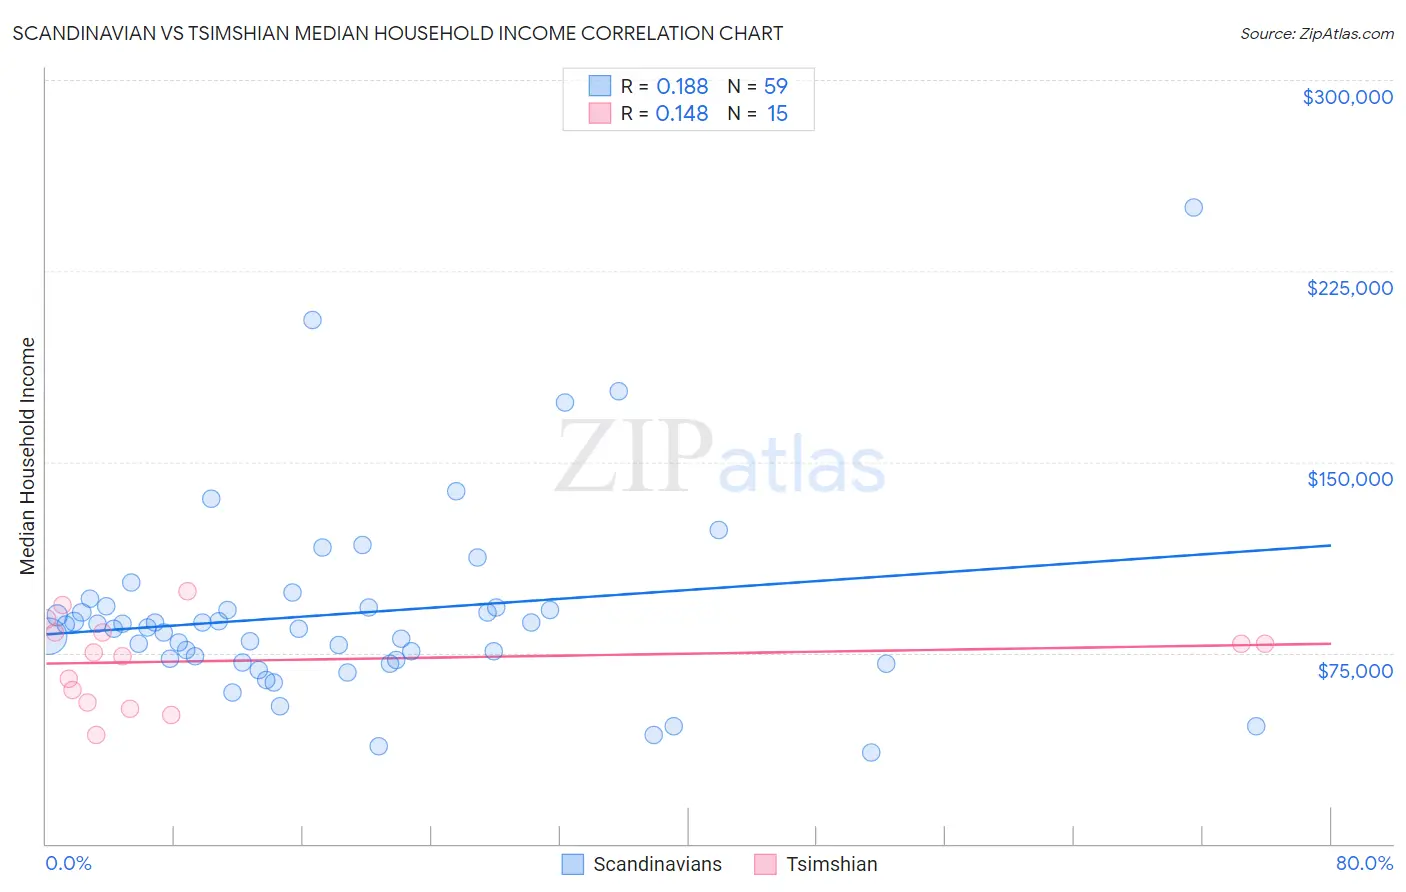
Scandinavian vs Tsimshian Median Household Income Correlation Chart
The statistical analysis conducted on geographies consisting of 472,110,165 people shows a poor positive correlation between the proportion of Scandinavians and median household income in the United States with a correlation coefficient (R) of 0.188 and weighted average of $86,073. Similarly, the statistical analysis conducted on geographies consisting of 15,626,462 people shows a poor positive correlation between the proportion of Tsimshian and median household income in the United States with a correlation coefficient (R) of 0.148 and weighted average of $83,346, a difference of 3.3%.
Median Household Income Correlation Summary
| Measurement | Scandinavian | Tsimshian |
| Minimum | $35,625 | $42,857 |
| Maximum | $250,001 | $99,167 |
| Range | $214,376 | $56,310 |
| Mean | $90,420 | $71,994 |
| Median | $84,951 | $75,000 |
| Interquartile 25% (IQ1) | $72,386 | $55,448 |
| Interquartile 75% (IQ3) | $92,885 | $83,217 |
| Interquartile Range (IQR) | $20,499 | $27,769 |
| Standard Deviation (Sample) | $37,436 | $16,777 |
| Standard Deviation (Population) | $37,118 | $16,208 |
Similar Demographics by Median Household Income
Demographics Similar to Scandinavians by Median Household Income
In terms of median household income, the demographic groups most similar to Scandinavians are Norwegian ($86,084, a difference of 0.010%), Irish ($86,145, a difference of 0.080%), Czech ($86,164, a difference of 0.11%), Guamanian/Chamorro ($86,255, a difference of 0.21%), and Immigrants ($85,818, a difference of 0.30%).
| Demographics | Rating | Rank | Median Household Income |
| Immigrants | Uzbekistan | 70.1 /100 | #159 | Good $86,425 |
| Luxembourgers | 70.0 /100 | #160 | Good $86,418 |
| Slavs | 69.7 /100 | #161 | Good $86,398 |
| Guamanians/Chamorros | 67.7 /100 | #162 | Good $86,255 |
| Czechs | 66.4 /100 | #163 | Good $86,164 |
| Irish | 66.2 /100 | #164 | Good $86,145 |
| Norwegians | 65.3 /100 | #165 | Good $86,084 |
| Scandinavians | 65.1 /100 | #166 | Good $86,073 |
| Immigrants | Immigrants | 61.3 /100 | #167 | Good $85,818 |
| Icelanders | 61.0 /100 | #168 | Good $85,797 |
| Colombians | 59.7 /100 | #169 | Average $85,716 |
| Swiss | 59.2 /100 | #170 | Average $85,681 |
| Immigrants | South America | 58.1 /100 | #171 | Average $85,611 |
| Slovenes | 57.4 /100 | #172 | Average $85,562 |
| Immigrants | Cameroon | 53.4 /100 | #173 | Average $85,314 |
Demographics Similar to Tsimshian by Median Household Income
In terms of median household income, the demographic groups most similar to Tsimshian are Spanish ($83,343, a difference of 0.0%), German ($83,358, a difference of 0.010%), Immigrants from Thailand ($83,327, a difference of 0.020%), Immigrants from Cambodia ($83,304, a difference of 0.050%), and Japanese ($83,395, a difference of 0.060%).
| Demographics | Rating | Rank | Median Household Income |
| Finns | 27.7 /100 | #193 | Fair $83,607 |
| Ghanaians | 27.4 /100 | #194 | Fair $83,582 |
| Immigrants | Armenia | 27.0 /100 | #195 | Fair $83,555 |
| French | 26.0 /100 | #196 | Fair $83,468 |
| Aleuts | 25.7 /100 | #197 | Fair $83,446 |
| Japanese | 25.1 /100 | #198 | Fair $83,395 |
| Germans | 24.6 /100 | #199 | Fair $83,358 |
| Tsimshian | 24.5 /100 | #200 | Fair $83,346 |
| Spanish | 24.4 /100 | #201 | Fair $83,343 |
| Immigrants | Thailand | 24.3 /100 | #202 | Fair $83,327 |
| Immigrants | Cambodia | 24.0 /100 | #203 | Fair $83,304 |
| Immigrants | Africa | 23.8 /100 | #204 | Fair $83,289 |
| Celtics | 22.7 /100 | #205 | Fair $83,193 |
| Immigrants | Kenya | 21.3 /100 | #206 | Fair $83,068 |
| Dutch | 20.3 /100 | #207 | Fair $82,971 |