Menominee vs Scottish Householder Income Ages 45 - 64 years
COMPARE
Menominee
Scottish
Householder Income Ages 45 - 64 years
Householder Income Ages 45 - 64 years Comparison
Menominee
Scottish
$76,903
HOUSEHOLDER INCOME AGES 45 - 64 YEARS
0.0/ 100
METRIC RATING
334th/ 347
METRIC RANK
$102,123
HOUSEHOLDER INCOME AGES 45 - 64 YEARS
71.1/ 100
METRIC RATING
162nd/ 347
METRIC RANK
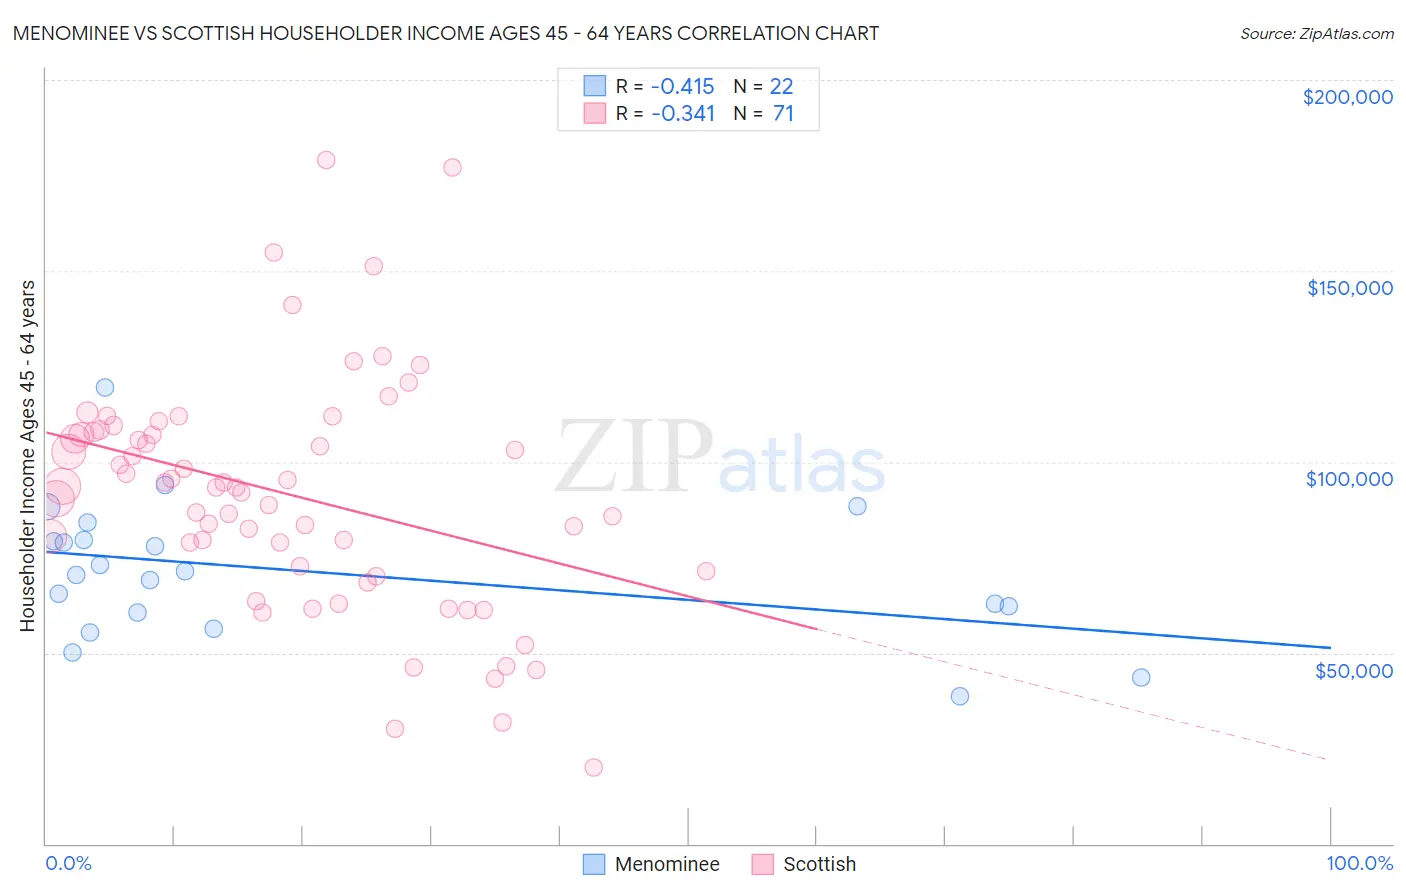
Menominee vs Scottish Householder Income Ages 45 - 64 years Correlation Chart
The statistical analysis conducted on geographies consisting of 45,774,690 people shows a moderate negative correlation between the proportion of Menominee and household income with householder between the ages 45 and 64 in the United States with a correlation coefficient (R) of -0.415 and weighted average of $76,903. Similarly, the statistical analysis conducted on geographies consisting of 563,389,205 people shows a mild negative correlation between the proportion of Scottish and household income with householder between the ages 45 and 64 in the United States with a correlation coefficient (R) of -0.341 and weighted average of $102,123, a difference of 32.8%.
Householder Income Ages 45 - 64 years Correlation Summary
| Measurement | Menominee | Scottish |
| Minimum | $38,750 | $20,057 |
| Maximum | $119,583 | $179,004 |
| Range | $80,833 | $158,947 |
| Mean | $71,291 | $91,449 |
| Median | $70,827 | $93,434 |
| Interquartile 25% (IQ1) | $60,417 | $71,369 |
| Interquartile 75% (IQ3) | $79,440 | $107,815 |
| Interquartile Range (IQR) | $19,023 | $36,446 |
| Standard Deviation (Sample) | $18,138 | $30,831 |
| Standard Deviation (Population) | $17,721 | $30,613 |
Similar Demographics by Householder Income Ages 45 - 64 years
Demographics Similar to Menominee by Householder Income Ages 45 - 64 years
In terms of householder income ages 45 - 64 years, the demographic groups most similar to Menominee are Cheyenne ($76,362, a difference of 0.71%), Immigrants from Congo ($77,850, a difference of 1.2%), Arapaho ($75,945, a difference of 1.3%), Pueblo ($75,601, a difference of 1.7%), and Hopi ($75,562, a difference of 1.8%).
| Demographics | Rating | Rank | Householder Income Ages 45 - 64 years |
| Seminole | 0.0 /100 | #327 | Tragic $80,077 |
| Natives/Alaskans | 0.0 /100 | #328 | Tragic $79,816 |
| Dutch West Indians | 0.0 /100 | #329 | Tragic $79,171 |
| Creek | 0.0 /100 | #330 | Tragic $78,960 |
| Immigrants | Dominican Republic | 0.0 /100 | #331 | Tragic $78,836 |
| Blacks/African Americans | 0.0 /100 | #332 | Tragic $78,556 |
| Immigrants | Congo | 0.0 /100 | #333 | Tragic $77,850 |
| Menominee | 0.0 /100 | #334 | Tragic $76,903 |
| Cheyenne | 0.0 /100 | #335 | Tragic $76,362 |
| Arapaho | 0.0 /100 | #336 | Tragic $75,945 |
| Pueblo | 0.0 /100 | #337 | Tragic $75,601 |
| Hopi | 0.0 /100 | #338 | Tragic $75,562 |
| Kiowa | 0.0 /100 | #339 | Tragic $74,815 |
| Immigrants | Yemen | 0.0 /100 | #340 | Tragic $74,575 |
| Crow | 0.0 /100 | #341 | Tragic $74,257 |
Demographics Similar to Scottish by Householder Income Ages 45 - 64 years
In terms of householder income ages 45 - 64 years, the demographic groups most similar to Scottish are Immigrants from Nepal ($102,190, a difference of 0.070%), English ($102,021, a difference of 0.10%), Immigrants from Morocco ($102,015, a difference of 0.11%), Icelander ($102,261, a difference of 0.14%), and Immigrants from Albania ($101,957, a difference of 0.16%).
| Demographics | Rating | Rank | Householder Income Ages 45 - 64 years |
| Costa Ricans | 77.4 /100 | #155 | Good $102,779 |
| Carpatho Rusyns | 77.4 /100 | #156 | Good $102,777 |
| Immigrants | Ethiopia | 77.3 /100 | #157 | Good $102,763 |
| Slavs | 76.1 /100 | #158 | Good $102,629 |
| Sierra Leoneans | 74.2 /100 | #159 | Good $102,427 |
| Icelanders | 72.5 /100 | #160 | Good $102,261 |
| Immigrants | Nepal | 71.8 /100 | #161 | Good $102,190 |
| Scottish | 71.1 /100 | #162 | Good $102,123 |
| English | 70.1 /100 | #163 | Good $102,021 |
| Immigrants | Morocco | 70.0 /100 | #164 | Good $102,015 |
| Immigrants | Albania | 69.4 /100 | #165 | Good $101,957 |
| Samoans | 65.3 /100 | #166 | Good $101,580 |
| Czechoslovakians | 63.0 /100 | #167 | Good $101,387 |
| South American Indians | 60.5 /100 | #168 | Good $101,171 |
| Guamanians/Chamorros | 60.5 /100 | #169 | Good $101,170 |