Colville vs Scottish Associate's Degree
COMPARE
Colville
Scottish
Associate's Degree
Associate's Degree Comparison
Colville
Scottish
38.5%
ASSOCIATE'S DEGREE
0.0/ 100
METRIC RATING
302nd/ 347
METRIC RANK
46.9%
ASSOCIATE'S DEGREE
65.4/ 100
METRIC RATING
160th/ 347
METRIC RANK
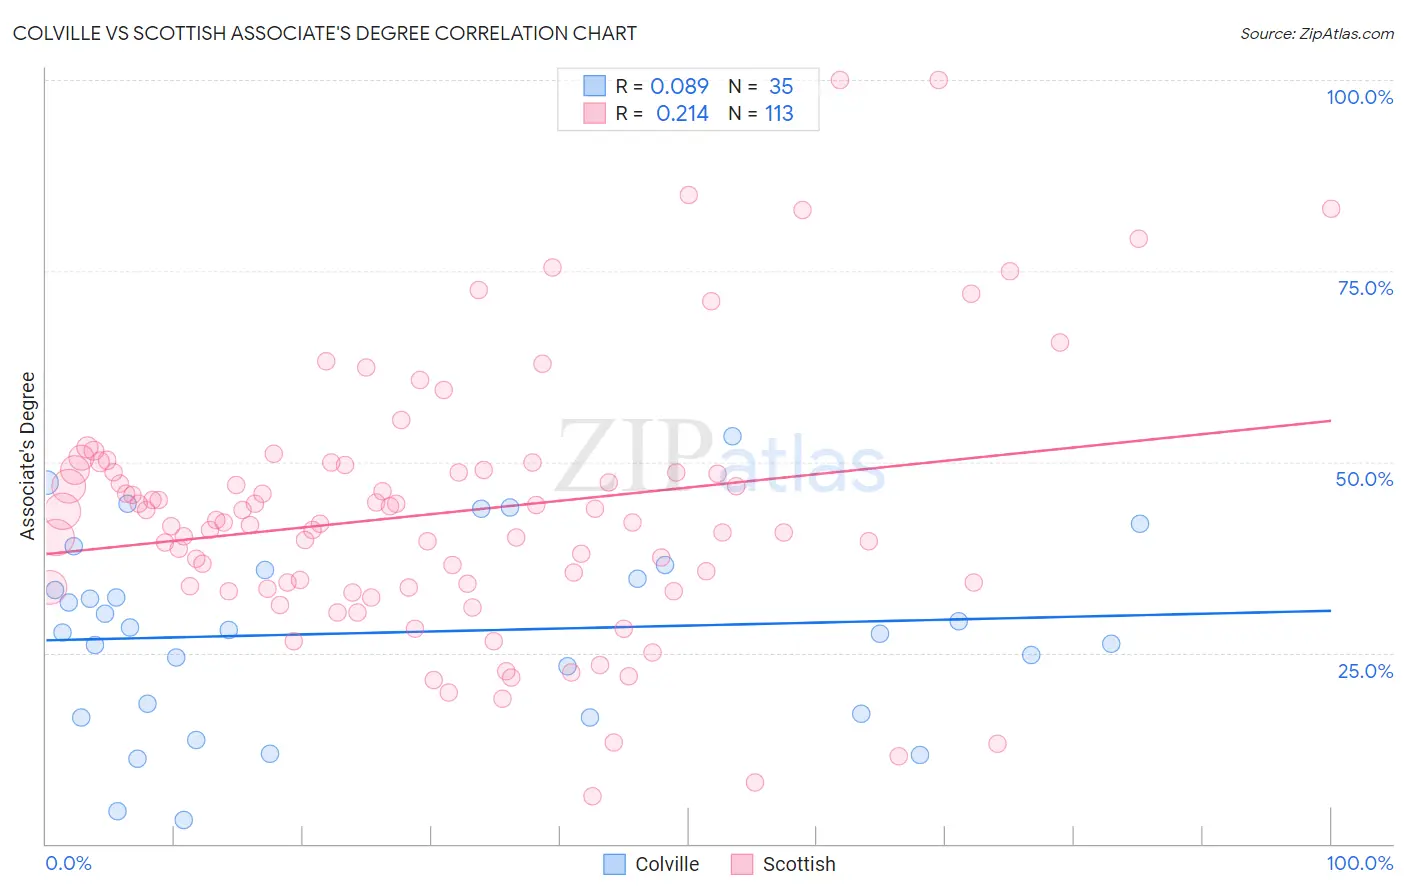
Colville vs Scottish Associate's Degree Correlation Chart
The statistical analysis conducted on geographies consisting of 34,684,410 people shows a slight positive correlation between the proportion of Colville and percentage of population with at least associate's degree education in the United States with a correlation coefficient (R) of 0.089 and weighted average of 38.5%. Similarly, the statistical analysis conducted on geographies consisting of 567,065,260 people shows a weak positive correlation between the proportion of Scottish and percentage of population with at least associate's degree education in the United States with a correlation coefficient (R) of 0.214 and weighted average of 46.9%, a difference of 21.7%.
Associate's Degree Correlation Summary
| Measurement | Colville | Scottish |
| Minimum | 3.2% | 6.2% |
| Maximum | 53.4% | 100.0% |
| Range | 50.2% | 93.7% |
| Mean | 27.7% | 43.3% |
| Median | 27.9% | 42.0% |
| Interquartile 25% (IQ1) | 17.1% | 33.6% |
| Interquartile 75% (IQ3) | 35.8% | 49.0% |
| Interquartile Range (IQR) | 18.7% | 15.4% |
| Standard Deviation (Sample) | 12.2% | 17.2% |
| Standard Deviation (Population) | 12.1% | 17.1% |
Similar Demographics by Associate's Degree
Demographics Similar to Colville by Associate's Degree
In terms of associate's degree, the demographic groups most similar to Colville are Guatemalan (38.5%, a difference of 0.090%), Sioux (38.5%, a difference of 0.14%), Tsimshian (38.6%, a difference of 0.15%), Chickasaw (38.6%, a difference of 0.20%), and Immigrants from Honduras (38.5%, a difference of 0.21%).
| Demographics | Rating | Rank | Associate's Degree |
| Hondurans | 0.0 /100 | #295 | Tragic 38.9% |
| Cherokee | 0.0 /100 | #296 | Tragic 38.9% |
| Cape Verdeans | 0.0 /100 | #297 | Tragic 38.8% |
| Cheyenne | 0.0 /100 | #298 | Tragic 38.7% |
| Ute | 0.0 /100 | #299 | Tragic 38.6% |
| Chickasaw | 0.0 /100 | #300 | Tragic 38.6% |
| Tsimshian | 0.0 /100 | #301 | Tragic 38.6% |
| Colville | 0.0 /100 | #302 | Tragic 38.5% |
| Guatemalans | 0.0 /100 | #303 | Tragic 38.5% |
| Sioux | 0.0 /100 | #304 | Tragic 38.5% |
| Immigrants | Honduras | 0.0 /100 | #305 | Tragic 38.5% |
| Shoshone | 0.0 /100 | #306 | Tragic 38.4% |
| Immigrants | El Salvador | 0.0 /100 | #307 | Tragic 38.4% |
| Mexican American Indians | 0.0 /100 | #308 | Tragic 38.2% |
| Immigrants | Guatemala | 0.0 /100 | #309 | Tragic 38.1% |
Demographics Similar to Scottish by Associate's Degree
In terms of associate's degree, the demographic groups most similar to Scottish are Scandinavian (46.9%, a difference of 0.020%), Immigrants from Africa (46.8%, a difference of 0.18%), Somali (46.8%, a difference of 0.23%), Colombian (46.8%, a difference of 0.24%), and Immigrants from Poland (47.1%, a difference of 0.31%).
| Demographics | Rating | Rank | Associate's Degree |
| Czechs | 72.2 /100 | #153 | Good 47.2% |
| Immigrants | Kenya | 72.1 /100 | #154 | Good 47.2% |
| Kenyans | 70.6 /100 | #155 | Good 47.1% |
| South Americans | 70.5 /100 | #156 | Good 47.1% |
| Sudanese | 70.3 /100 | #157 | Good 47.1% |
| Immigrants | Germany | 69.7 /100 | #158 | Good 47.1% |
| Immigrants | Poland | 69.2 /100 | #159 | Good 47.1% |
| Scottish | 65.4 /100 | #160 | Good 46.9% |
| Scandinavians | 65.2 /100 | #161 | Good 46.9% |
| Immigrants | Africa | 63.2 /100 | #162 | Good 46.8% |
| Somalis | 62.5 /100 | #163 | Good 46.8% |
| Colombians | 62.4 /100 | #164 | Good 46.8% |
| Immigrants | South America | 59.9 /100 | #165 | Average 46.7% |
| Hungarians | 59.3 /100 | #166 | Average 46.7% |
| Immigrants | Sierra Leone | 59.2 /100 | #167 | Average 46.7% |