Colville vs Immigrants from Bangladesh Births to Unmarried Women
COMPARE
Colville
Immigrants from Bangladesh
Births to Unmarried Women
Births to Unmarried Women Comparison
Colville
Immigrants from Bangladesh
45.3%
BIRTHS TO UNMARRIED WOMEN
0.0/ 100
METRIC RATING
335th/ 347
METRIC RANK
30.9%
BIRTHS TO UNMARRIED WOMEN
73.9/ 100
METRIC RATING
155th/ 347
METRIC RANK
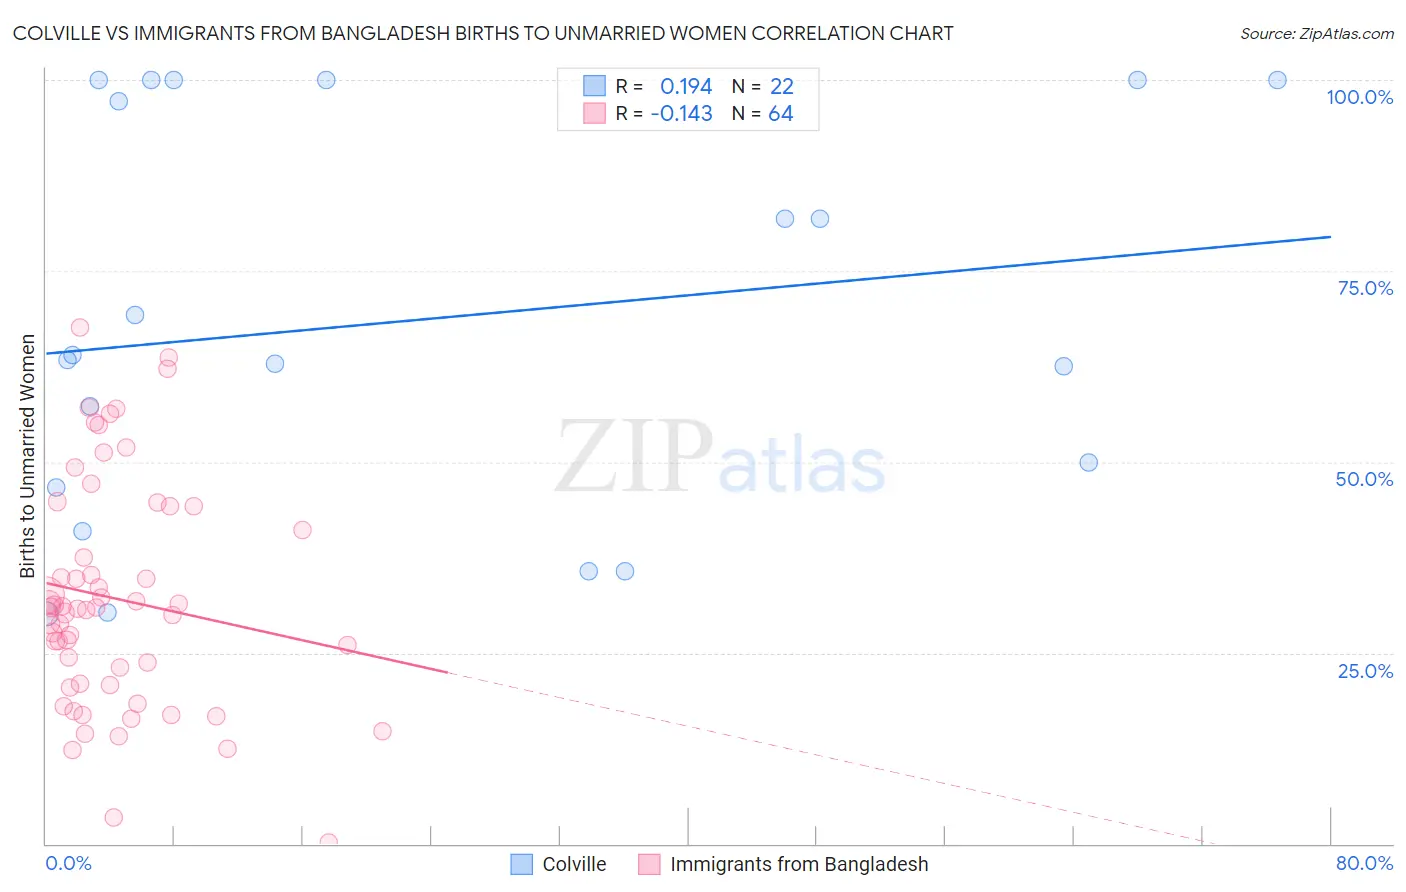
Colville vs Immigrants from Bangladesh Births to Unmarried Women Correlation Chart
The statistical analysis conducted on geographies consisting of 34,225,261 people shows a poor positive correlation between the proportion of Colville and percentage of births to unmarried women in the United States with a correlation coefficient (R) of 0.194 and weighted average of 45.3%. Similarly, the statistical analysis conducted on geographies consisting of 195,686,757 people shows a poor negative correlation between the proportion of Immigrants from Bangladesh and percentage of births to unmarried women in the United States with a correlation coefficient (R) of -0.143 and weighted average of 30.9%, a difference of 46.7%.
Births to Unmarried Women Correlation Summary
| Measurement | Colville | Immigrants from Bangladesh |
| Minimum | 30.2% | 0.20% |
| Maximum | 100.0% | 67.6% |
| Range | 69.8% | 67.4% |
| Mean | 68.6% | 32.1% |
| Median | 63.7% | 30.8% |
| Interquartile 25% (IQ1) | 46.7% | 20.9% |
| Interquartile 75% (IQ3) | 100.0% | 42.6% |
| Interquartile Range (IQR) | 53.3% | 21.8% |
| Standard Deviation (Sample) | 25.9% | 14.9% |
| Standard Deviation (Population) | 25.3% | 14.8% |
Similar Demographics by Births to Unmarried Women
Demographics Similar to Colville by Births to Unmarried Women
In terms of births to unmarried women, the demographic groups most similar to Colville are Puerto Rican (45.7%, a difference of 0.78%), Yuman (44.4%, a difference of 2.1%), Black/African American (44.3%, a difference of 2.3%), Houma (46.6%, a difference of 2.7%), and Arapaho (47.1%, a difference of 4.0%).
| Demographics | Rating | Rank | Births to Unmarried Women |
| Immigrants | Cabo Verde | 0.0 /100 | #328 | Tragic 42.2% |
| Paiute | 0.0 /100 | #329 | Tragic 42.5% |
| Chippewa | 0.0 /100 | #330 | Tragic 42.6% |
| Natives/Alaskans | 0.0 /100 | #331 | Tragic 43.0% |
| Kiowa | 0.0 /100 | #332 | Tragic 43.1% |
| Blacks/African Americans | 0.0 /100 | #333 | Tragic 44.3% |
| Yuman | 0.0 /100 | #334 | Tragic 44.4% |
| Colville | 0.0 /100 | #335 | Tragic 45.3% |
| Puerto Ricans | 0.0 /100 | #336 | Tragic 45.7% |
| Houma | 0.0 /100 | #337 | Tragic 46.6% |
| Arapaho | 0.0 /100 | #338 | Tragic 47.1% |
| Lumbee | 0.0 /100 | #339 | Tragic 48.2% |
| Tohono O'odham | 0.0 /100 | #340 | Tragic 49.8% |
| Hopi | 0.0 /100 | #341 | Tragic 50.8% |
| Menominee | 0.0 /100 | #342 | Tragic 51.1% |
Demographics Similar to Immigrants from Bangladesh by Births to Unmarried Women
In terms of births to unmarried women, the demographic groups most similar to Immigrants from Bangladesh are Carpatho Rusyn (30.9%, a difference of 0.050%), Yugoslavian (30.8%, a difference of 0.15%), Immigrants from Eastern Africa (31.0%, a difference of 0.22%), British (30.8%, a difference of 0.27%), and Polish (30.8%, a difference of 0.29%).
| Demographics | Rating | Rank | Births to Unmarried Women |
| Chileans | 79.1 /100 | #148 | Good 30.7% |
| Serbians | 78.8 /100 | #149 | Good 30.7% |
| Somalis | 77.8 /100 | #150 | Good 30.7% |
| Italians | 77.0 /100 | #151 | Good 30.8% |
| Poles | 76.2 /100 | #152 | Good 30.8% |
| British | 76.0 /100 | #153 | Good 30.8% |
| Yugoslavians | 75.1 /100 | #154 | Good 30.8% |
| Immigrants | Bangladesh | 73.9 /100 | #155 | Good 30.9% |
| Carpatho Rusyns | 73.5 /100 | #156 | Good 30.9% |
| Immigrants | Eastern Africa | 72.1 /100 | #157 | Good 31.0% |
| Austrians | 69.9 /100 | #158 | Good 31.0% |
| Immigrants | England | 69.4 /100 | #159 | Good 31.1% |
| Immigrants | Western Europe | 69.3 /100 | #160 | Good 31.1% |
| Immigrants | Southern Europe | 68.7 /100 | #161 | Good 31.1% |
| Slovenes | 65.9 /100 | #162 | Good 31.2% |