Colombian vs Pueblo Median Female Earnings
COMPARE
Colombian
Pueblo
Median Female Earnings
Median Female Earnings Comparison
Colombians
Pueblo
$39,439
MEDIAN FEMALE EARNINGS
36.9/ 100
METRIC RATING
186th/ 347
METRIC RANK
$32,564
MEDIAN FEMALE EARNINGS
0.0/ 100
METRIC RATING
343rd/ 347
METRIC RANK
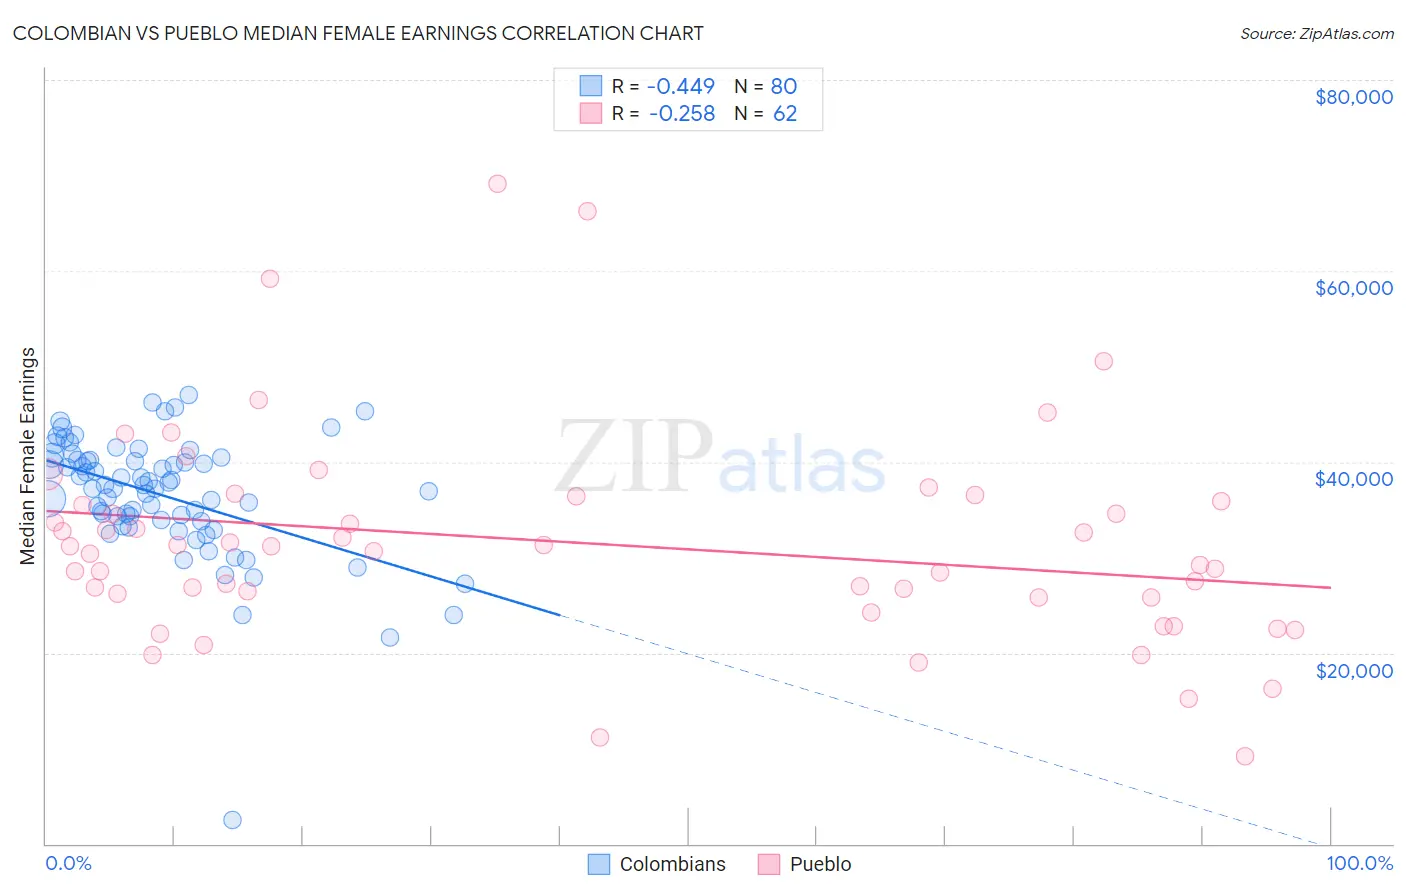
Colombian vs Pueblo Median Female Earnings Correlation Chart
The statistical analysis conducted on geographies consisting of 419,536,375 people shows a moderate negative correlation between the proportion of Colombians and median female earnings in the United States with a correlation coefficient (R) of -0.449 and weighted average of $39,439. Similarly, the statistical analysis conducted on geographies consisting of 120,036,612 people shows a weak negative correlation between the proportion of Pueblo and median female earnings in the United States with a correlation coefficient (R) of -0.258 and weighted average of $32,564, a difference of 21.1%.
Median Female Earnings Correlation Summary
| Measurement | Colombian | Pueblo |
| Minimum | $2,499 | $9,219 |
| Maximum | $46,974 | $69,074 |
| Range | $44,475 | $59,855 |
| Mean | $36,461 | $31,512 |
| Median | $37,418 | $30,863 |
| Interquartile 25% (IQ1) | $33,852 | $25,792 |
| Interquartile 75% (IQ3) | $40,193 | $35,833 |
| Interquartile Range (IQR) | $6,341 | $10,041 |
| Standard Deviation (Sample) | $6,518 | $11,084 |
| Standard Deviation (Population) | $6,477 | $10,994 |
Similar Demographics by Median Female Earnings
Demographics Similar to Colombians by Median Female Earnings
In terms of median female earnings, the demographic groups most similar to Colombians are Immigrants from West Indies ($39,441, a difference of 0.0%), European ($39,457, a difference of 0.040%), Swedish ($39,421, a difference of 0.050%), Bermudan ($39,418, a difference of 0.050%), and Senegalese ($39,384, a difference of 0.14%).
| Demographics | Rating | Rank | Median Female Earnings |
| Immigrants | Germany | 45.1 /100 | #179 | Average $39,603 |
| Immigrants | Kenya | 41.6 /100 | #180 | Average $39,535 |
| Tsimshian | 41.4 /100 | #181 | Average $39,530 |
| Tlingit-Haida | 40.5 /100 | #182 | Average $39,513 |
| Hungarians | 40.3 /100 | #183 | Average $39,510 |
| Europeans | 37.7 /100 | #184 | Fair $39,457 |
| Immigrants | West Indies | 36.9 /100 | #185 | Fair $39,441 |
| Colombians | 36.9 /100 | #186 | Fair $39,439 |
| Swedes | 36.0 /100 | #187 | Fair $39,421 |
| Bermudans | 35.9 /100 | #188 | Fair $39,418 |
| Senegalese | 34.2 /100 | #189 | Fair $39,384 |
| Puget Sound Salish | 33.9 /100 | #190 | Fair $39,376 |
| Immigrants | Western Africa | 32.7 /100 | #191 | Fair $39,351 |
| Immigrants | Immigrants | 31.7 /100 | #192 | Fair $39,328 |
| Immigrants | Nigeria | 30.2 /100 | #193 | Fair $39,294 |
Demographics Similar to Pueblo by Median Female Earnings
In terms of median female earnings, the demographic groups most similar to Pueblo are Lumbee ($32,500, a difference of 0.20%), Yup'ik ($32,730, a difference of 0.51%), Navajo ($33,046, a difference of 1.5%), Tohono O'odham ($33,205, a difference of 2.0%), and Immigrants from Mexico ($33,236, a difference of 2.1%).
| Demographics | Rating | Rank | Median Female Earnings |
| Mexicans | 0.0 /100 | #333 | Tragic $33,664 |
| Spanish American Indians | 0.0 /100 | #334 | Tragic $33,625 |
| Creek | 0.0 /100 | #335 | Tragic $33,437 |
| Ottawa | 0.0 /100 | #336 | Tragic $33,378 |
| Yakama | 0.0 /100 | #337 | Tragic $33,354 |
| Immigrants | Cuba | 0.0 /100 | #338 | Tragic $33,291 |
| Immigrants | Mexico | 0.0 /100 | #339 | Tragic $33,236 |
| Tohono O'odham | 0.0 /100 | #340 | Tragic $33,205 |
| Navajo | 0.0 /100 | #341 | Tragic $33,046 |
| Yup'ik | 0.0 /100 | #342 | Tragic $32,730 |
| Pueblo | 0.0 /100 | #343 | Tragic $32,564 |
| Lumbee | 0.0 /100 | #344 | Tragic $32,500 |
| Puerto Ricans | 0.0 /100 | #345 | Tragic $31,560 |
| Arapaho | 0.0 /100 | #346 | Tragic $31,489 |
| Houma | 0.0 /100 | #347 | Tragic $30,343 |