Immigrants from Cambodia vs Immigrants from Uruguay Median Household Income
COMPARE
Immigrants from Cambodia
Immigrants from Uruguay
Median Household Income
Median Household Income Comparison
Immigrants from Cambodia
Immigrants from Uruguay
$83,304
MEDIAN HOUSEHOLD INCOME
24.0/ 100
METRIC RATING
203rd/ 347
METRIC RANK
$82,560
MEDIAN HOUSEHOLD INCOME
16.4/ 100
METRIC RATING
210th/ 347
METRIC RANK
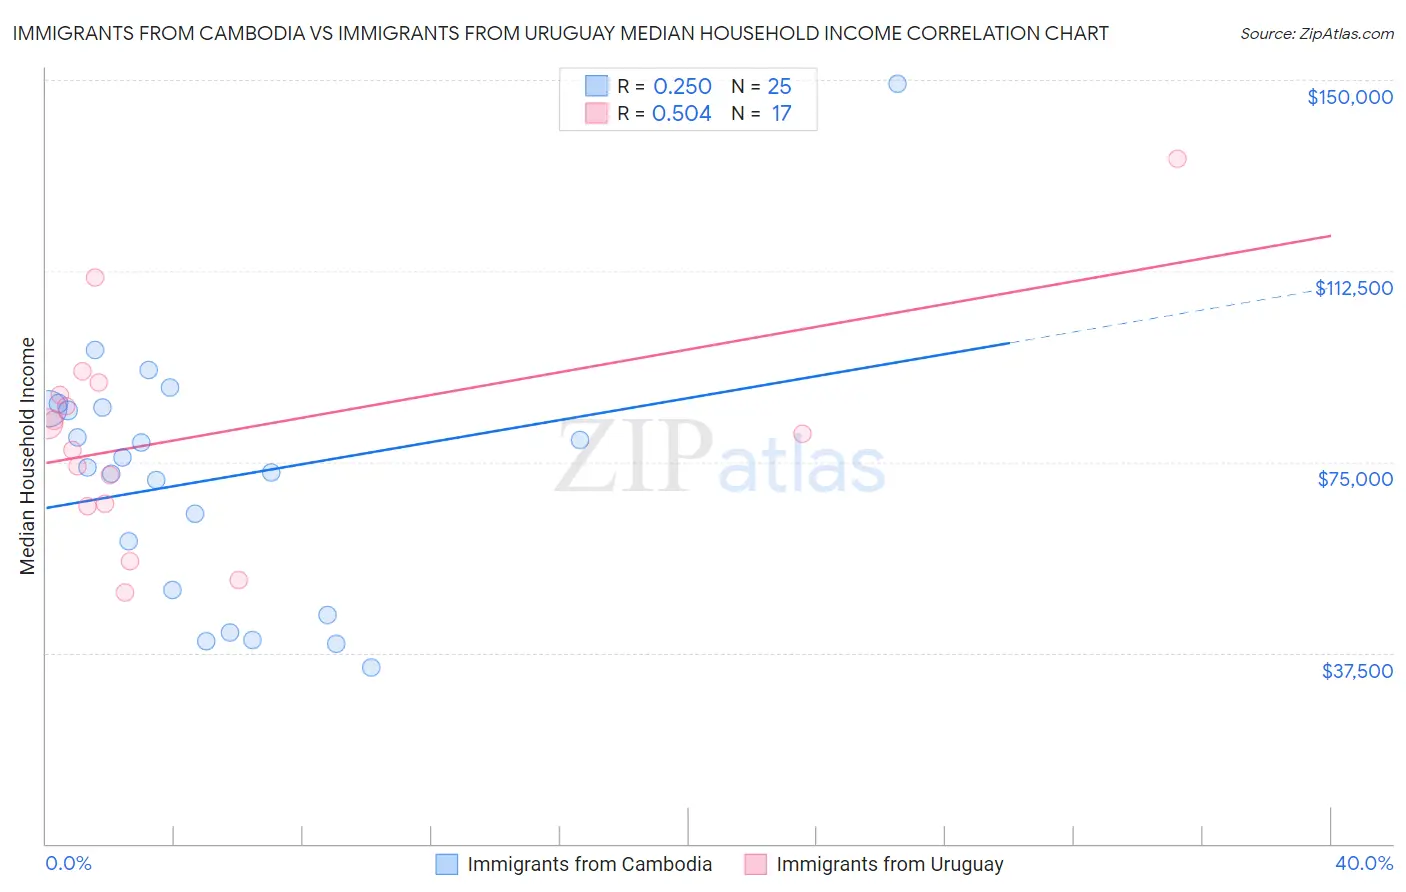
Immigrants from Cambodia vs Immigrants from Uruguay Median Household Income Correlation Chart
The statistical analysis conducted on geographies consisting of 205,122,161 people shows a weak positive correlation between the proportion of Immigrants from Cambodia and median household income in the United States with a correlation coefficient (R) of 0.250 and weighted average of $83,304. Similarly, the statistical analysis conducted on geographies consisting of 133,237,976 people shows a substantial positive correlation between the proportion of Immigrants from Uruguay and median household income in the United States with a correlation coefficient (R) of 0.504 and weighted average of $82,560, a difference of 0.90%.
Median Household Income Correlation Summary
| Measurement | Immigrants from Cambodia | Immigrants from Uruguay |
| Minimum | $34,518 | $49,241 |
| Maximum | $149,239 | $134,635 |
| Range | $114,721 | $85,394 |
| Mean | $71,594 | $80,181 |
| Median | $73,842 | $80,417 |
| Interquartile 25% (IQ1) | $47,361 | $66,523 |
| Interquartile 75% (IQ3) | $85,484 | $89,275 |
| Interquartile Range (IQR) | $38,123 | $22,752 |
| Standard Deviation (Sample) | $25,130 | $21,157 |
| Standard Deviation (Population) | $24,622 | $20,525 |
Demographics Similar to Immigrants from Cambodia and Immigrants from Uruguay by Median Household Income
In terms of median household income, the demographic groups most similar to Immigrants from Cambodia are Immigrants from Africa ($83,289, a difference of 0.020%), Immigrants from Thailand ($83,327, a difference of 0.030%), Tsimshian ($83,346, a difference of 0.050%), Spanish ($83,343, a difference of 0.050%), and German ($83,358, a difference of 0.070%). Similarly, the demographic groups most similar to Immigrants from Uruguay are Immigrants from Iraq ($82,594, a difference of 0.040%), Salvadoran ($82,449, a difference of 0.14%), Venezuelan ($82,432, a difference of 0.16%), Nepalese ($82,410, a difference of 0.18%), and French Canadian ($82,810, a difference of 0.30%).
| Demographics | Rating | Rank | Median Household Income |
| French | 26.0 /100 | #196 | Fair $83,468 |
| Aleuts | 25.7 /100 | #197 | Fair $83,446 |
| Japanese | 25.1 /100 | #198 | Fair $83,395 |
| Germans | 24.6 /100 | #199 | Fair $83,358 |
| Tsimshian | 24.5 /100 | #200 | Fair $83,346 |
| Spanish | 24.4 /100 | #201 | Fair $83,343 |
| Immigrants | Thailand | 24.3 /100 | #202 | Fair $83,327 |
| Immigrants | Cambodia | 24.0 /100 | #203 | Fair $83,304 |
| Immigrants | Africa | 23.8 /100 | #204 | Fair $83,289 |
| Celtics | 22.7 /100 | #205 | Fair $83,193 |
| Immigrants | Kenya | 21.3 /100 | #206 | Fair $83,068 |
| Dutch | 20.3 /100 | #207 | Fair $82,971 |
| French Canadians | 18.7 /100 | #208 | Poor $82,810 |
| Immigrants | Iraq | 16.7 /100 | #209 | Poor $82,594 |
| Immigrants | Uruguay | 16.4 /100 | #210 | Poor $82,560 |
| Salvadorans | 15.4 /100 | #211 | Poor $82,449 |
| Venezuelans | 15.3 /100 | #212 | Poor $82,432 |
| Nepalese | 15.1 /100 | #213 | Poor $82,410 |
| Panamanians | 14.0 /100 | #214 | Poor $82,272 |
| Vietnamese | 13.8 /100 | #215 | Poor $82,248 |
| Yugoslavians | 13.3 /100 | #216 | Poor $82,186 |