Colombian vs Cheyenne Householder Income Ages 25 - 44 years
COMPARE
Colombian
Cheyenne
Householder Income Ages 25 - 44 years
Householder Income Ages 25 - 44 years Comparison
Colombians
Cheyenne
$94,565
HOUSEHOLDER INCOME AGES 25 - 44 YEARS
50.0/ 100
METRIC RATING
174th/ 347
METRIC RANK
$79,152
HOUSEHOLDER INCOME AGES 25 - 44 YEARS
0.0/ 100
METRIC RATING
314th/ 347
METRIC RANK
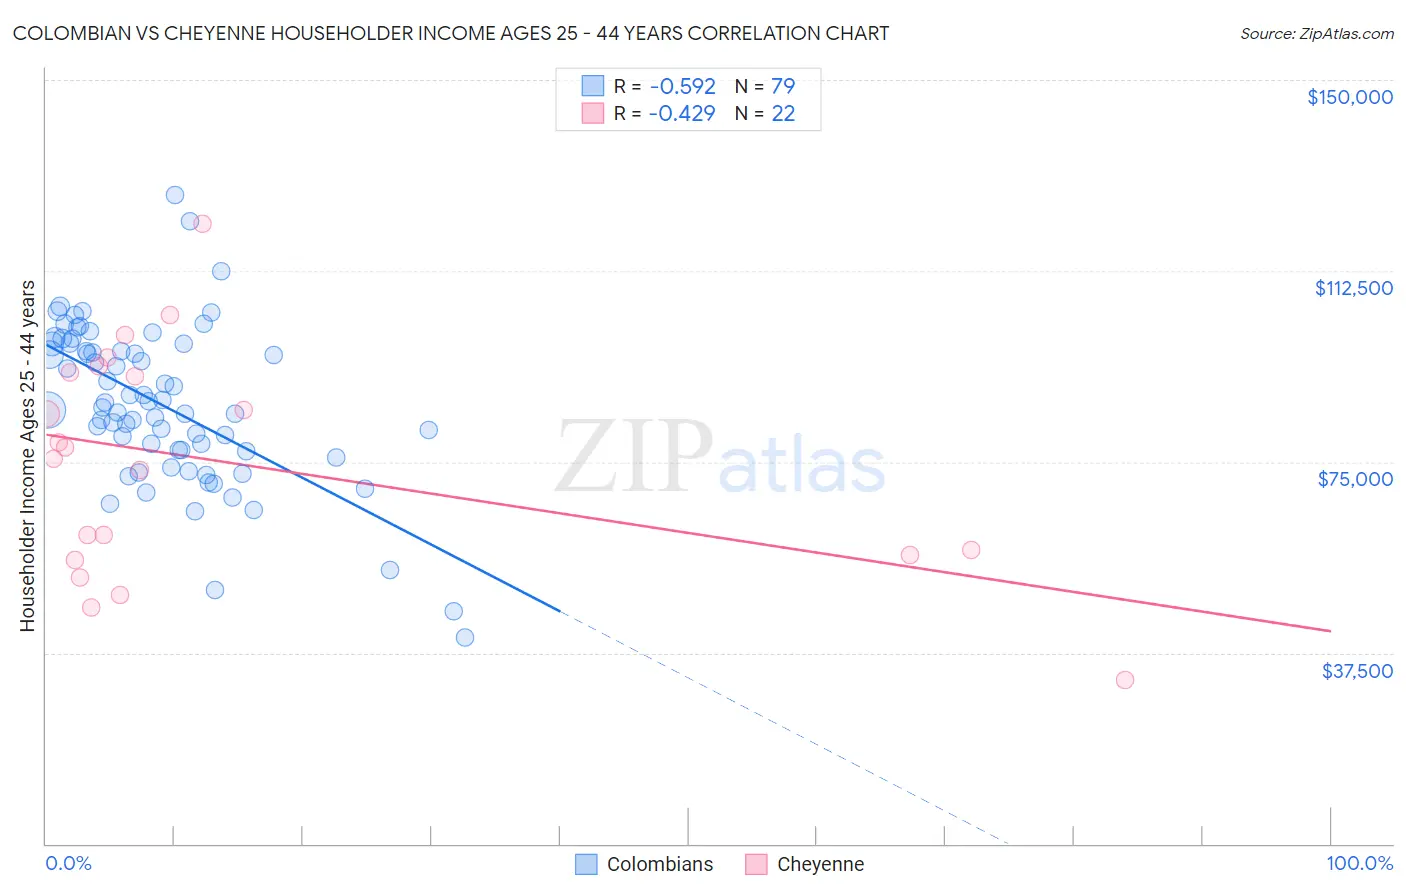
Colombian vs Cheyenne Householder Income Ages 25 - 44 years Correlation Chart
The statistical analysis conducted on geographies consisting of 418,592,310 people shows a substantial negative correlation between the proportion of Colombians and household income with householder between the ages 25 and 44 in the United States with a correlation coefficient (R) of -0.592 and weighted average of $94,565. Similarly, the statistical analysis conducted on geographies consisting of 80,627,434 people shows a moderate negative correlation between the proportion of Cheyenne and household income with householder between the ages 25 and 44 in the United States with a correlation coefficient (R) of -0.429 and weighted average of $79,152, a difference of 19.5%.
Householder Income Ages 25 - 44 years Correlation Summary
| Measurement | Colombian | Cheyenne |
| Minimum | $40,446 | $32,083 |
| Maximum | $127,452 | $121,699 |
| Range | $87,006 | $89,616 |
| Mean | $86,168 | $74,807 |
| Median | $85,799 | $76,769 |
| Interquartile 25% (IQ1) | $77,037 | $56,719 |
| Interquartile 75% (IQ3) | $98,109 | $92,585 |
| Interquartile Range (IQR) | $21,072 | $35,866 |
| Standard Deviation (Sample) | $15,709 | $22,346 |
| Standard Deviation (Population) | $15,610 | $21,832 |
Similar Demographics by Householder Income Ages 25 - 44 years
Demographics Similar to Colombians by Householder Income Ages 25 - 44 years
In terms of householder income ages 25 - 44 years, the demographic groups most similar to Colombians are Finnish ($94,610, a difference of 0.050%), Scottish ($94,622, a difference of 0.060%), English ($94,429, a difference of 0.14%), Immigrants ($94,423, a difference of 0.15%), and Immigrants from Armenia ($94,867, a difference of 0.32%).
| Demographics | Rating | Rank | Householder Income Ages 25 - 44 years |
| Czechoslovakians | 57.0 /100 | #167 | Average $95,070 |
| Alsatians | 56.8 /100 | #168 | Average $95,059 |
| Native Hawaiians | 56.8 /100 | #169 | Average $95,058 |
| Slovaks | 56.4 /100 | #170 | Average $95,032 |
| Immigrants | Armenia | 54.2 /100 | #171 | Average $94,867 |
| Scottish | 50.8 /100 | #172 | Average $94,622 |
| Finns | 50.6 /100 | #173 | Average $94,610 |
| Colombians | 50.0 /100 | #174 | Average $94,565 |
| English | 48.1 /100 | #175 | Average $94,429 |
| Immigrants | Immigrants | 48.0 /100 | #176 | Average $94,423 |
| Belgians | 45.8 /100 | #177 | Average $94,262 |
| Immigrants | South America | 42.8 /100 | #178 | Average $94,042 |
| French Canadians | 38.2 /100 | #179 | Fair $93,694 |
| French | 37.8 /100 | #180 | Fair $93,665 |
| Puget Sound Salish | 37.7 /100 | #181 | Fair $93,661 |
Demographics Similar to Cheyenne by Householder Income Ages 25 - 44 years
In terms of householder income ages 25 - 44 years, the demographic groups most similar to Cheyenne are Ottawa ($79,012, a difference of 0.18%), African ($78,986, a difference of 0.21%), Menominee ($79,358, a difference of 0.26%), Immigrants from Haiti ($79,391, a difference of 0.30%), and U.S. Virgin Islander ($78,911, a difference of 0.30%).
| Demographics | Rating | Rank | Householder Income Ages 25 - 44 years |
| Haitians | 0.0 /100 | #307 | Tragic $80,055 |
| Immigrants | Central America | 0.0 /100 | #308 | Tragic $80,012 |
| Chippewa | 0.0 /100 | #309 | Tragic $80,005 |
| Fijians | 0.0 /100 | #310 | Tragic $79,956 |
| Indonesians | 0.0 /100 | #311 | Tragic $79,543 |
| Immigrants | Haiti | 0.0 /100 | #312 | Tragic $79,391 |
| Menominee | 0.0 /100 | #313 | Tragic $79,358 |
| Cheyenne | 0.0 /100 | #314 | Tragic $79,152 |
| Ottawa | 0.0 /100 | #315 | Tragic $79,012 |
| Africans | 0.0 /100 | #316 | Tragic $78,986 |
| U.S. Virgin Islanders | 0.0 /100 | #317 | Tragic $78,911 |
| Immigrants | Mexico | 0.0 /100 | #318 | Tragic $78,809 |
| Hondurans | 0.0 /100 | #319 | Tragic $78,540 |
| Choctaw | 0.0 /100 | #320 | Tragic $78,168 |
| Immigrants | Zaire | 0.0 /100 | #321 | Tragic $78,045 |