Colombian vs Immigrants from Western Africa Householder Income Ages 25 - 44 years
COMPARE
Colombian
Immigrants from Western Africa
Householder Income Ages 25 - 44 years
Householder Income Ages 25 - 44 years Comparison
Colombians
Immigrants from Western Africa
$94,565
HOUSEHOLDER INCOME AGES 25 - 44 YEARS
50.0/ 100
METRIC RATING
174th/ 347
METRIC RANK
$85,676
HOUSEHOLDER INCOME AGES 25 - 44 YEARS
0.7/ 100
METRIC RATING
252nd/ 347
METRIC RANK
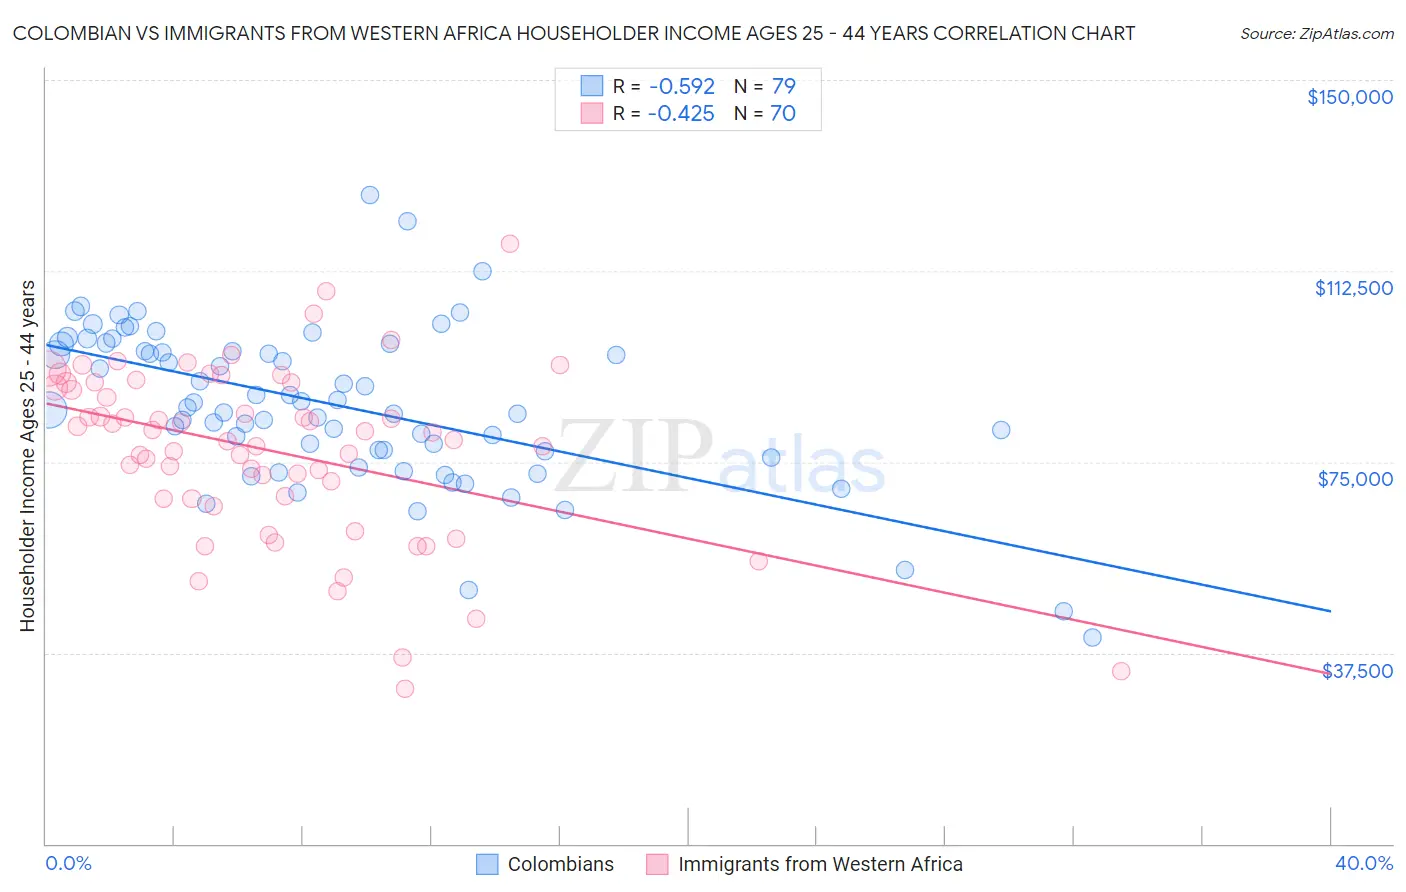
Colombian vs Immigrants from Western Africa Householder Income Ages 25 - 44 years Correlation Chart
The statistical analysis conducted on geographies consisting of 418,592,310 people shows a substantial negative correlation between the proportion of Colombians and household income with householder between the ages 25 and 44 in the United States with a correlation coefficient (R) of -0.592 and weighted average of $94,565. Similarly, the statistical analysis conducted on geographies consisting of 357,136,258 people shows a moderate negative correlation between the proportion of Immigrants from Western Africa and household income with householder between the ages 25 and 44 in the United States with a correlation coefficient (R) of -0.425 and weighted average of $85,676, a difference of 10.4%.
Householder Income Ages 25 - 44 years Correlation Summary
| Measurement | Colombian | Immigrants from Western Africa |
| Minimum | $40,446 | $30,517 |
| Maximum | $127,452 | $117,804 |
| Range | $87,006 | $87,287 |
| Mean | $86,168 | $77,170 |
| Median | $85,799 | $80,034 |
| Interquartile 25% (IQ1) | $77,037 | $67,813 |
| Interquartile 75% (IQ3) | $98,109 | $90,526 |
| Interquartile Range (IQR) | $21,072 | $22,713 |
| Standard Deviation (Sample) | $15,709 | $17,090 |
| Standard Deviation (Population) | $15,610 | $16,967 |
Similar Demographics by Householder Income Ages 25 - 44 years
Demographics Similar to Colombians by Householder Income Ages 25 - 44 years
In terms of householder income ages 25 - 44 years, the demographic groups most similar to Colombians are Finnish ($94,610, a difference of 0.050%), Scottish ($94,622, a difference of 0.060%), English ($94,429, a difference of 0.14%), Immigrants ($94,423, a difference of 0.15%), and Immigrants from Armenia ($94,867, a difference of 0.32%).
| Demographics | Rating | Rank | Householder Income Ages 25 - 44 years |
| Czechoslovakians | 57.0 /100 | #167 | Average $95,070 |
| Alsatians | 56.8 /100 | #168 | Average $95,059 |
| Native Hawaiians | 56.8 /100 | #169 | Average $95,058 |
| Slovaks | 56.4 /100 | #170 | Average $95,032 |
| Immigrants | Armenia | 54.2 /100 | #171 | Average $94,867 |
| Scottish | 50.8 /100 | #172 | Average $94,622 |
| Finns | 50.6 /100 | #173 | Average $94,610 |
| Colombians | 50.0 /100 | #174 | Average $94,565 |
| English | 48.1 /100 | #175 | Average $94,429 |
| Immigrants | Immigrants | 48.0 /100 | #176 | Average $94,423 |
| Belgians | 45.8 /100 | #177 | Average $94,262 |
| Immigrants | South America | 42.8 /100 | #178 | Average $94,042 |
| French Canadians | 38.2 /100 | #179 | Fair $93,694 |
| French | 37.8 /100 | #180 | Fair $93,665 |
| Puget Sound Salish | 37.7 /100 | #181 | Fair $93,661 |
Demographics Similar to Immigrants from Western Africa by Householder Income Ages 25 - 44 years
In terms of householder income ages 25 - 44 years, the demographic groups most similar to Immigrants from Western Africa are Cape Verdean ($85,758, a difference of 0.10%), British West Indian ($85,565, a difference of 0.13%), Immigrants from Laos ($85,553, a difference of 0.14%), Pennsylvania German ($85,836, a difference of 0.19%), and French American Indian ($85,899, a difference of 0.26%).
| Demographics | Rating | Rank | Householder Income Ages 25 - 44 years |
| Immigrants | El Salvador | 1.4 /100 | #245 | Tragic $86,913 |
| Immigrants | Burma/Myanmar | 1.3 /100 | #246 | Tragic $86,736 |
| Immigrants | Nigeria | 1.2 /100 | #247 | Tragic $86,589 |
| Immigrants | Sudan | 0.9 /100 | #248 | Tragic $86,109 |
| French American Indians | 0.8 /100 | #249 | Tragic $85,899 |
| Pennsylvania Germans | 0.8 /100 | #250 | Tragic $85,836 |
| Cape Verdeans | 0.8 /100 | #251 | Tragic $85,758 |
| Immigrants | Western Africa | 0.7 /100 | #252 | Tragic $85,676 |
| British West Indians | 0.7 /100 | #253 | Tragic $85,565 |
| Immigrants | Laos | 0.7 /100 | #254 | Tragic $85,553 |
| German Russians | 0.6 /100 | #255 | Tragic $85,220 |
| Central Americans | 0.5 /100 | #256 | Tragic $85,144 |
| Mexican American Indians | 0.5 /100 | #257 | Tragic $85,066 |
| Immigrants | Nicaragua | 0.5 /100 | #258 | Tragic $84,914 |
| Immigrants | Senegal | 0.5 /100 | #259 | Tragic $84,848 |