Trinidadian and Tobagonian vs Immigrants from Taiwan Householder Income Ages 25 - 44 years
COMPARE
Trinidadian and Tobagonian
Immigrants from Taiwan
Householder Income Ages 25 - 44 years
Householder Income Ages 25 - 44 years Comparison
Trinidadians and Tobagonians
Immigrants from Taiwan
$89,856
HOUSEHOLDER INCOME AGES 25 - 44 YEARS
6.8/ 100
METRIC RATING
220th/ 347
METRIC RANK
$129,122
HOUSEHOLDER INCOME AGES 25 - 44 YEARS
100.0/ 100
METRIC RATING
1st/ 347
METRIC RANK
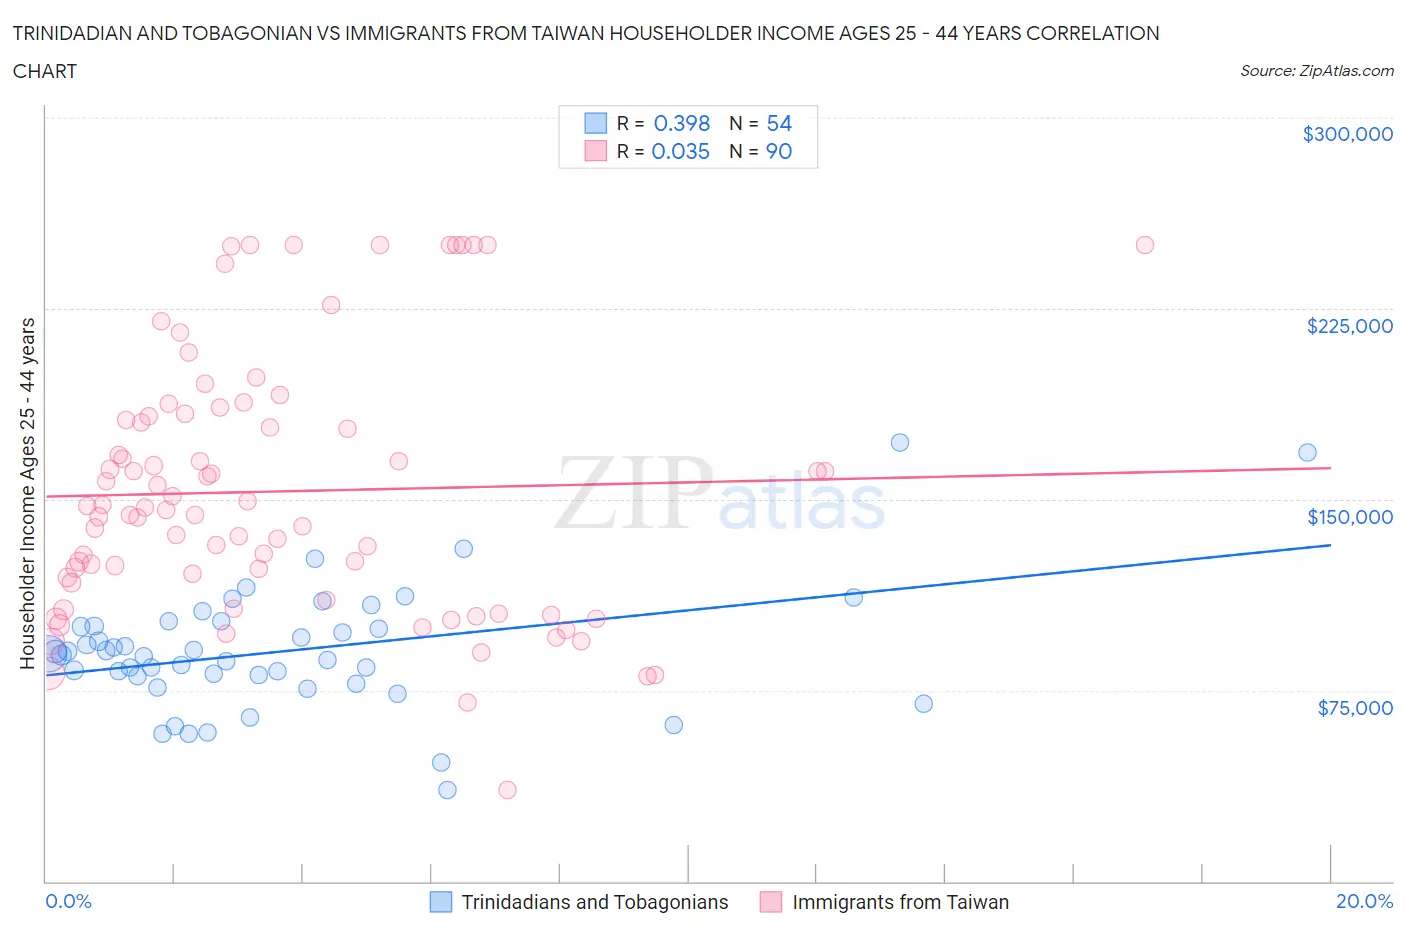
Trinidadian and Tobagonian vs Immigrants from Taiwan Householder Income Ages 25 - 44 years Correlation Chart
The statistical analysis conducted on geographies consisting of 219,529,863 people shows a mild positive correlation between the proportion of Trinidadians and Tobagonians and household income with householder between the ages 25 and 44 in the United States with a correlation coefficient (R) of 0.398 and weighted average of $89,856. Similarly, the statistical analysis conducted on geographies consisting of 297,780,144 people shows no correlation between the proportion of Immigrants from Taiwan and household income with householder between the ages 25 and 44 in the United States with a correlation coefficient (R) of 0.035 and weighted average of $129,122, a difference of 43.7%.
Householder Income Ages 25 - 44 years Correlation Summary
| Measurement | Trinidadian and Tobagonian | Immigrants from Taiwan |
| Minimum | $35,714 | $35,653 |
| Maximum | $172,171 | $250,001 |
| Range | $136,457 | $214,348 |
| Mean | $90,466 | $153,134 |
| Median | $88,984 | $146,407 |
| Interquartile 25% (IQ1) | $80,428 | $117,158 |
| Interquartile 75% (IQ3) | $100,047 | $182,503 |
| Interquartile Range (IQR) | $19,619 | $65,344 |
| Standard Deviation (Sample) | $24,416 | $50,634 |
| Standard Deviation (Population) | $24,189 | $50,352 |
Similar Demographics by Householder Income Ages 25 - 44 years
Demographics Similar to Trinidadians and Tobagonians by Householder Income Ages 25 - 44 years
In terms of householder income ages 25 - 44 years, the demographic groups most similar to Trinidadians and Tobagonians are Delaware ($89,876, a difference of 0.020%), Guyanese ($89,940, a difference of 0.090%), Immigrants from Trinidad and Tobago ($89,748, a difference of 0.12%), Scotch-Irish ($89,969, a difference of 0.13%), and Immigrants from Ecuador ($89,673, a difference of 0.20%).
| Demographics | Rating | Rank | Householder Income Ages 25 - 44 years |
| Immigrants | Bangladesh | 9.3 /100 | #213 | Tragic $90,448 |
| Immigrants | Africa | 8.9 /100 | #214 | Tragic $90,372 |
| Panamanians | 8.1 /100 | #215 | Tragic $90,193 |
| Ghanaians | 7.9 /100 | #216 | Tragic $90,137 |
| Scotch-Irish | 7.3 /100 | #217 | Tragic $89,969 |
| Guyanese | 7.1 /100 | #218 | Tragic $89,940 |
| Delaware | 6.9 /100 | #219 | Tragic $89,876 |
| Trinidadians and Tobagonians | 6.8 /100 | #220 | Tragic $89,856 |
| Immigrants | Trinidad and Tobago | 6.5 /100 | #221 | Tragic $89,748 |
| Immigrants | Ecuador | 6.2 /100 | #222 | Tragic $89,673 |
| Immigrants | Guyana | 5.9 /100 | #223 | Tragic $89,586 |
| Barbadians | 5.9 /100 | #224 | Tragic $89,565 |
| Immigrants | Panama | 5.5 /100 | #225 | Tragic $89,451 |
| Immigrants | Iraq | 5.5 /100 | #226 | Tragic $89,444 |
| Immigrants | St. Vincent and the Grenadines | 4.1 /100 | #227 | Tragic $88,888 |
Demographics Similar to Immigrants from Taiwan by Householder Income Ages 25 - 44 years
In terms of householder income ages 25 - 44 years, the demographic groups most similar to Immigrants from Taiwan are Filipino ($128,723, a difference of 0.31%), Immigrants from Hong Kong ($128,140, a difference of 0.77%), Immigrants from Singapore ($124,429, a difference of 3.8%), Immigrants from India ($124,238, a difference of 3.9%), and Thai ($121,778, a difference of 6.0%).
| Demographics | Rating | Rank | Householder Income Ages 25 - 44 years |
| Immigrants | Taiwan | 100.0 /100 | #1 | Exceptional $129,122 |
| Filipinos | 100.0 /100 | #2 | Exceptional $128,723 |
| Immigrants | Hong Kong | 100.0 /100 | #3 | Exceptional $128,140 |
| Immigrants | Singapore | 100.0 /100 | #4 | Exceptional $124,429 |
| Immigrants | India | 100.0 /100 | #5 | Exceptional $124,238 |
| Thais | 100.0 /100 | #6 | Exceptional $121,778 |
| Immigrants | Ireland | 100.0 /100 | #7 | Exceptional $120,333 |
| Iranians | 100.0 /100 | #8 | Exceptional $120,292 |
| Immigrants | China | 100.0 /100 | #9 | Exceptional $119,756 |
| Indians (Asian) | 100.0 /100 | #10 | Exceptional $119,496 |
| Okinawans | 100.0 /100 | #11 | Exceptional $119,349 |
| Immigrants | Iran | 100.0 /100 | #12 | Exceptional $119,204 |
| Immigrants | Eastern Asia | 100.0 /100 | #13 | Exceptional $118,056 |
| Immigrants | Israel | 100.0 /100 | #14 | Exceptional $117,219 |
| Immigrants | South Central Asia | 100.0 /100 | #15 | Exceptional $116,626 |