Colombian vs Ute Householder Income Ages 25 - 44 years
COMPARE
Colombian
Ute
Householder Income Ages 25 - 44 years
Householder Income Ages 25 - 44 years Comparison
Colombians
Ute
$94,565
HOUSEHOLDER INCOME AGES 25 - 44 YEARS
50.0/ 100
METRIC RATING
174th/ 347
METRIC RANK
$82,166
HOUSEHOLDER INCOME AGES 25 - 44 YEARS
0.1/ 100
METRIC RATING
286th/ 347
METRIC RANK
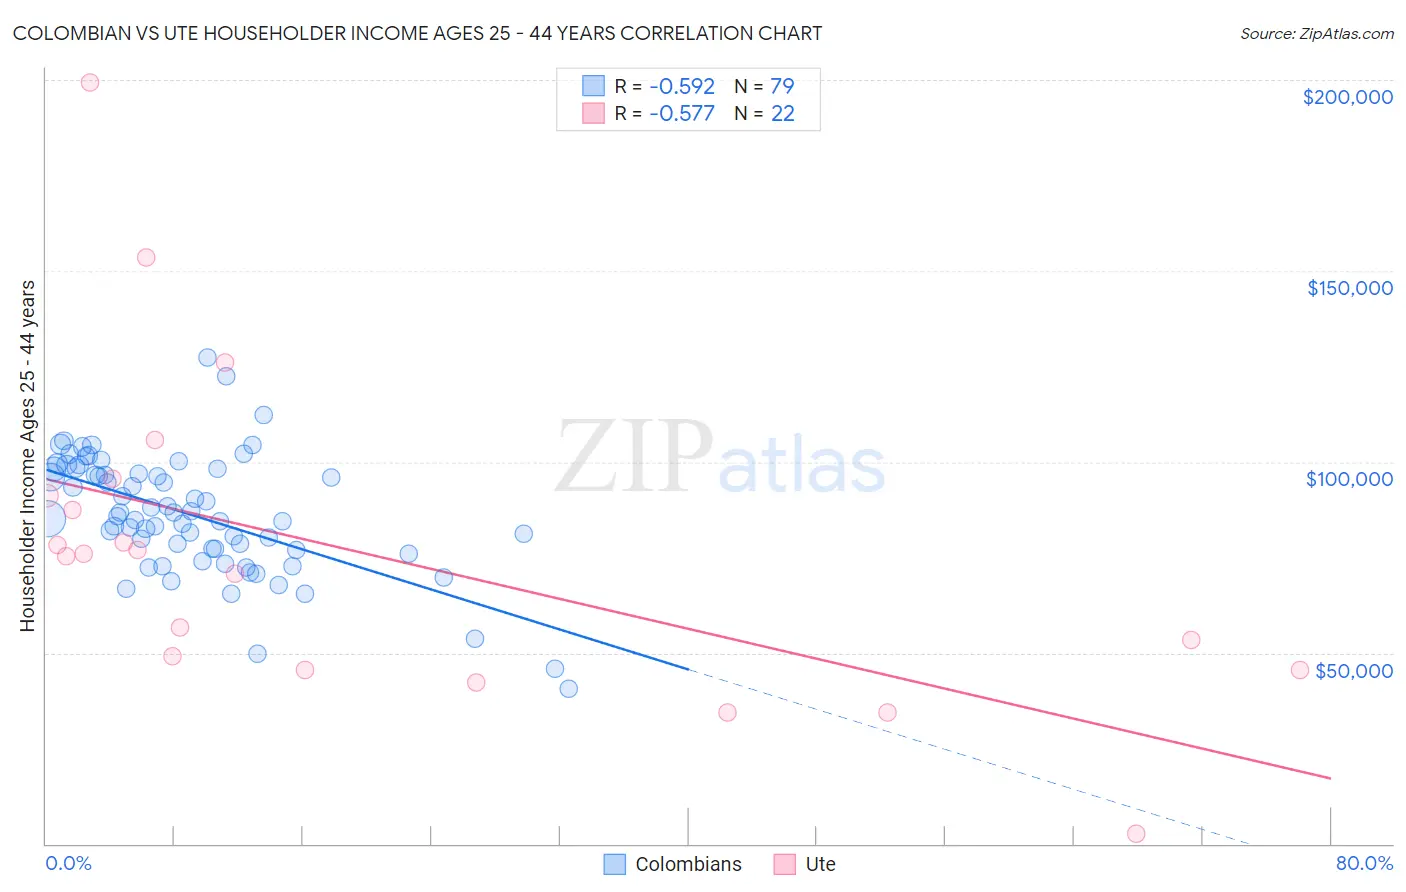
Colombian vs Ute Householder Income Ages 25 - 44 years Correlation Chart
The statistical analysis conducted on geographies consisting of 418,592,310 people shows a substantial negative correlation between the proportion of Colombians and household income with householder between the ages 25 and 44 in the United States with a correlation coefficient (R) of -0.592 and weighted average of $94,565. Similarly, the statistical analysis conducted on geographies consisting of 55,634,339 people shows a substantial negative correlation between the proportion of Ute and household income with householder between the ages 25 and 44 in the United States with a correlation coefficient (R) of -0.577 and weighted average of $82,166, a difference of 15.1%.
Householder Income Ages 25 - 44 years Correlation Summary
| Measurement | Colombian | Ute |
| Minimum | $40,446 | $2,499 |
| Maximum | $127,452 | $199,336 |
| Range | $87,006 | $196,837 |
| Mean | $86,168 | $76,298 |
| Median | $85,799 | $75,607 |
| Interquartile 25% (IQ1) | $77,037 | $45,625 |
| Interquartile 75% (IQ3) | $98,109 | $91,160 |
| Interquartile Range (IQR) | $21,072 | $45,535 |
| Standard Deviation (Sample) | $15,709 | $43,022 |
| Standard Deviation (Population) | $15,610 | $42,033 |
Similar Demographics by Householder Income Ages 25 - 44 years
Demographics Similar to Colombians by Householder Income Ages 25 - 44 years
In terms of householder income ages 25 - 44 years, the demographic groups most similar to Colombians are Finnish ($94,610, a difference of 0.050%), Scottish ($94,622, a difference of 0.060%), English ($94,429, a difference of 0.14%), Immigrants ($94,423, a difference of 0.15%), and Immigrants from Armenia ($94,867, a difference of 0.32%).
| Demographics | Rating | Rank | Householder Income Ages 25 - 44 years |
| Czechoslovakians | 57.0 /100 | #167 | Average $95,070 |
| Alsatians | 56.8 /100 | #168 | Average $95,059 |
| Native Hawaiians | 56.8 /100 | #169 | Average $95,058 |
| Slovaks | 56.4 /100 | #170 | Average $95,032 |
| Immigrants | Armenia | 54.2 /100 | #171 | Average $94,867 |
| Scottish | 50.8 /100 | #172 | Average $94,622 |
| Finns | 50.6 /100 | #173 | Average $94,610 |
| Colombians | 50.0 /100 | #174 | Average $94,565 |
| English | 48.1 /100 | #175 | Average $94,429 |
| Immigrants | Immigrants | 48.0 /100 | #176 | Average $94,423 |
| Belgians | 45.8 /100 | #177 | Average $94,262 |
| Immigrants | South America | 42.8 /100 | #178 | Average $94,042 |
| French Canadians | 38.2 /100 | #179 | Fair $93,694 |
| French | 37.8 /100 | #180 | Fair $93,665 |
| Puget Sound Salish | 37.7 /100 | #181 | Fair $93,661 |
Demographics Similar to Ute by Householder Income Ages 25 - 44 years
In terms of householder income ages 25 - 44 years, the demographic groups most similar to Ute are Immigrants from Latin America ($82,166, a difference of 0.0%), Comanche ($82,152, a difference of 0.020%), Immigrants from Somalia ($82,188, a difference of 0.030%), Immigrants from Middle Africa ($82,254, a difference of 0.11%), and Shoshone ($82,062, a difference of 0.13%).
| Demographics | Rating | Rank | Householder Income Ages 25 - 44 years |
| Pima | 0.1 /100 | #279 | Tragic $82,821 |
| Colville | 0.1 /100 | #280 | Tragic $82,604 |
| Cajuns | 0.1 /100 | #281 | Tragic $82,393 |
| Central American Indians | 0.1 /100 | #282 | Tragic $82,355 |
| Guatemalans | 0.1 /100 | #283 | Tragic $82,331 |
| Immigrants | Middle Africa | 0.1 /100 | #284 | Tragic $82,254 |
| Immigrants | Somalia | 0.1 /100 | #285 | Tragic $82,188 |
| Ute | 0.1 /100 | #286 | Tragic $82,166 |
| Immigrants | Latin America | 0.1 /100 | #287 | Tragic $82,166 |
| Comanche | 0.1 /100 | #288 | Tragic $82,152 |
| Shoshone | 0.1 /100 | #289 | Tragic $82,062 |
| Liberians | 0.1 /100 | #290 | Tragic $82,005 |
| Potawatomi | 0.1 /100 | #291 | Tragic $81,774 |
| Yaqui | 0.1 /100 | #292 | Tragic $81,656 |
| Blackfeet | 0.1 /100 | #293 | Tragic $81,531 |