Colombian vs Cheyenne Births to Unmarried Women
COMPARE
Colombian
Cheyenne
Births to Unmarried Women
Births to Unmarried Women Comparison
Colombians
Cheyenne
32.2%
BIRTHS TO UNMARRIED WOMEN
31.9/ 100
METRIC RATING
192nd/ 347
METRIC RANK
41.3%
BIRTHS TO UNMARRIED WOMEN
0.0/ 100
METRIC RATING
325th/ 347
METRIC RANK
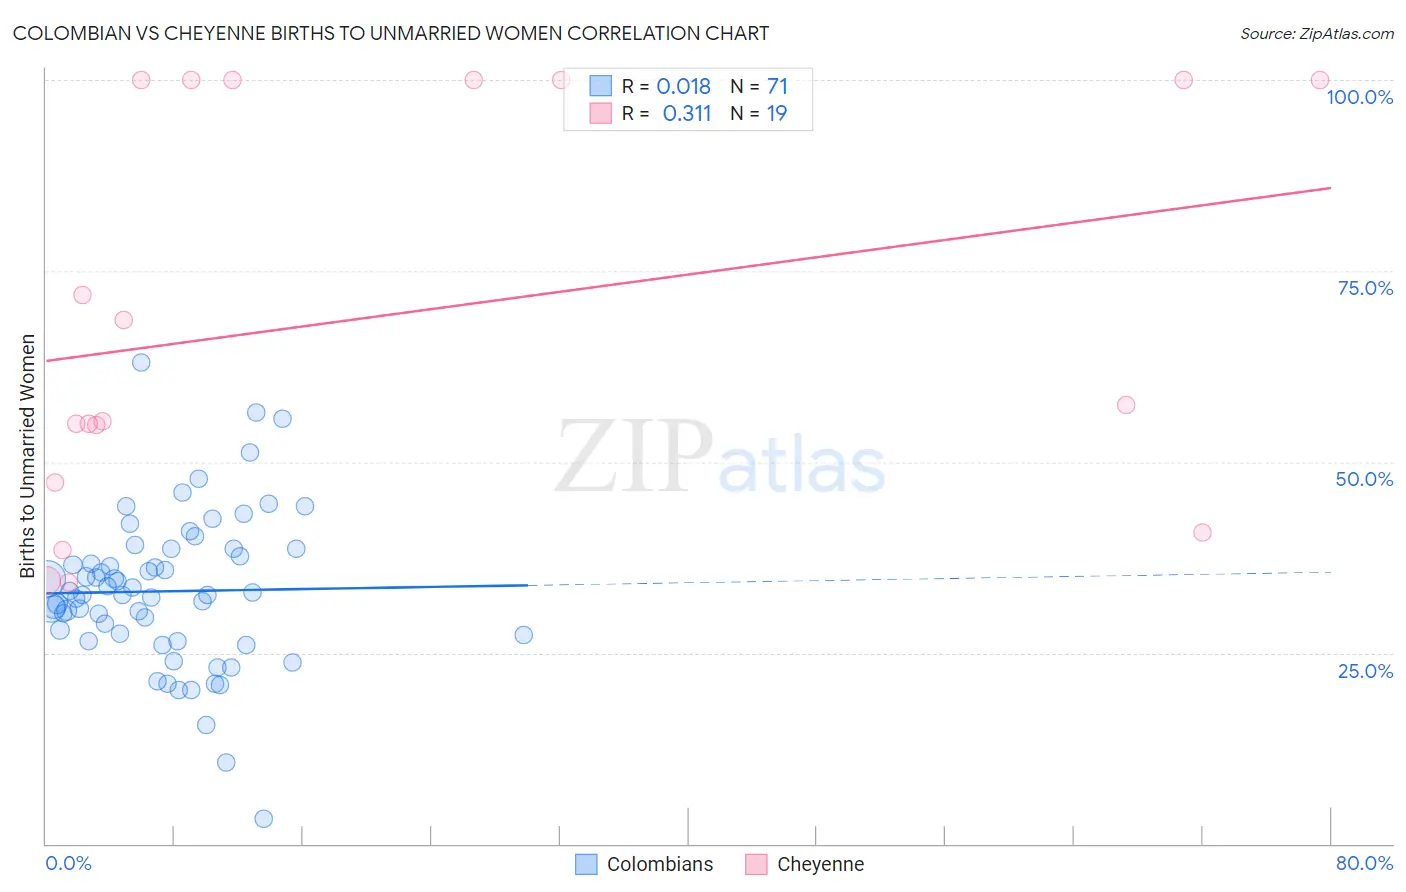
Colombian vs Cheyenne Births to Unmarried Women Correlation Chart
The statistical analysis conducted on geographies consisting of 391,716,321 people shows no correlation between the proportion of Colombians and percentage of births to unmarried women in the United States with a correlation coefficient (R) of 0.018 and weighted average of 32.2%. Similarly, the statistical analysis conducted on geographies consisting of 79,528,425 people shows a mild positive correlation between the proportion of Cheyenne and percentage of births to unmarried women in the United States with a correlation coefficient (R) of 0.311 and weighted average of 41.3%, a difference of 28.2%.
Births to Unmarried Women Correlation Summary
| Measurement | Colombian | Cheyenne |
| Minimum | 3.3% | 34.1% |
| Maximum | 63.0% | 100.0% |
| Range | 59.7% | 65.9% |
| Mean | 33.1% | 69.1% |
| Median | 32.6% | 57.4% |
| Interquartile 25% (IQ1) | 27.3% | 47.3% |
| Interquartile 75% (IQ3) | 38.6% | 100.0% |
| Interquartile Range (IQR) | 11.3% | 52.7% |
| Standard Deviation (Sample) | 10.0% | 26.1% |
| Standard Deviation (Population) | 9.9% | 25.4% |
Similar Demographics by Births to Unmarried Women
Demographics Similar to Colombians by Births to Unmarried Women
In terms of births to unmarried women, the demographic groups most similar to Colombians are Irish (32.2%, a difference of 0.050%), Tlingit-Haida (32.2%, a difference of 0.080%), Fijian (32.3%, a difference of 0.090%), Sudanese (32.4%, a difference of 0.51%), and Immigrants from Kenya (32.1%, a difference of 0.52%).
| Demographics | Rating | Rank | Births to Unmarried Women |
| Germans | 39.5 /100 | #185 | Fair 32.0% |
| Welsh | 38.2 /100 | #186 | Fair 32.0% |
| Czechoslovakians | 38.0 /100 | #187 | Fair 32.0% |
| Osage | 37.1 /100 | #188 | Fair 32.1% |
| Immigrants | Kenya | 36.9 /100 | #189 | Fair 32.1% |
| Tlingit-Haida | 32.6 /100 | #190 | Fair 32.2% |
| Irish | 32.4 /100 | #191 | Fair 32.2% |
| Colombians | 31.9 /100 | #192 | Fair 32.2% |
| Fijians | 31.1 /100 | #193 | Fair 32.3% |
| Sudanese | 27.3 /100 | #194 | Fair 32.4% |
| Samoans | 21.9 /100 | #195 | Fair 32.6% |
| Immigrants | Colombia | 21.7 /100 | #196 | Fair 32.6% |
| Immigrants | Immigrants | 20.6 /100 | #197 | Fair 32.7% |
| Costa Ricans | 20.3 /100 | #198 | Fair 32.7% |
| Immigrants | Thailand | 18.9 /100 | #199 | Poor 32.8% |
Demographics Similar to Cheyenne by Births to Unmarried Women
In terms of births to unmarried women, the demographic groups most similar to Cheyenne are Cape Verdean (41.3%, a difference of 0.060%), Immigrants from Cuba (41.5%, a difference of 0.27%), Sioux (41.0%, a difference of 0.85%), Cajun (41.0%, a difference of 0.93%), and Bahamian (40.8%, a difference of 1.4%).
| Demographics | Rating | Rank | Births to Unmarried Women |
| Immigrants | Bahamas | 0.0 /100 | #318 | Tragic 40.1% |
| Yakama | 0.0 /100 | #319 | Tragic 40.3% |
| Crow | 0.0 /100 | #320 | Tragic 40.4% |
| Bahamians | 0.0 /100 | #321 | Tragic 40.8% |
| Cajuns | 0.0 /100 | #322 | Tragic 41.0% |
| Sioux | 0.0 /100 | #323 | Tragic 41.0% |
| Cape Verdeans | 0.0 /100 | #324 | Tragic 41.3% |
| Cheyenne | 0.0 /100 | #325 | Tragic 41.3% |
| Immigrants | Cuba | 0.0 /100 | #326 | Tragic 41.5% |
| Tsimshian | 0.0 /100 | #327 | Tragic 42.2% |
| Immigrants | Cabo Verde | 0.0 /100 | #328 | Tragic 42.2% |
| Paiute | 0.0 /100 | #329 | Tragic 42.5% |
| Chippewa | 0.0 /100 | #330 | Tragic 42.6% |
| Natives/Alaskans | 0.0 /100 | #331 | Tragic 43.0% |
| Kiowa | 0.0 /100 | #332 | Tragic 43.1% |