Czech vs Cheyenne Householder Income Ages 25 - 44 years
COMPARE
Czech
Cheyenne
Householder Income Ages 25 - 44 years
Householder Income Ages 25 - 44 years Comparison
Czechs
Cheyenne
$96,525
HOUSEHOLDER INCOME AGES 25 - 44 YEARS
74.8/ 100
METRIC RATING
151st/ 347
METRIC RANK
$79,152
HOUSEHOLDER INCOME AGES 25 - 44 YEARS
0.0/ 100
METRIC RATING
314th/ 347
METRIC RANK
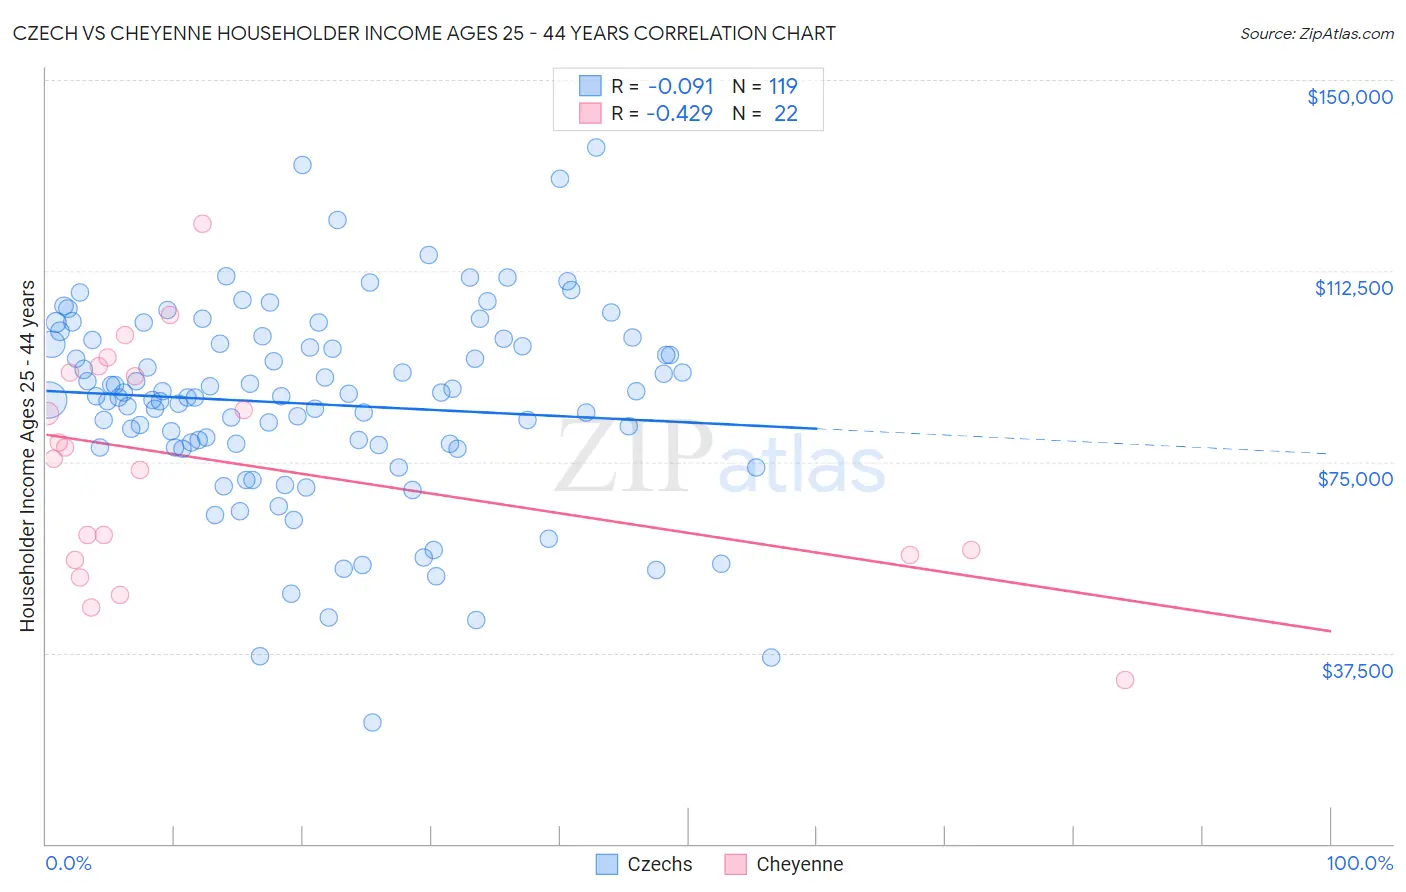
Czech vs Cheyenne Householder Income Ages 25 - 44 years Correlation Chart
The statistical analysis conducted on geographies consisting of 482,514,709 people shows a slight negative correlation between the proportion of Czechs and household income with householder between the ages 25 and 44 in the United States with a correlation coefficient (R) of -0.091 and weighted average of $96,525. Similarly, the statistical analysis conducted on geographies consisting of 80,627,434 people shows a moderate negative correlation between the proportion of Cheyenne and household income with householder between the ages 25 and 44 in the United States with a correlation coefficient (R) of -0.429 and weighted average of $79,152, a difference of 22.0%.
Householder Income Ages 25 - 44 years Correlation Summary
| Measurement | Czech | Cheyenne |
| Minimum | $23,929 | $32,083 |
| Maximum | $136,755 | $121,699 |
| Range | $112,826 | $89,616 |
| Mean | $86,343 | $74,807 |
| Median | $87,904 | $76,769 |
| Interquartile 25% (IQ1) | $77,941 | $56,719 |
| Interquartile 75% (IQ3) | $99,022 | $92,585 |
| Interquartile Range (IQR) | $21,080 | $35,866 |
| Standard Deviation (Sample) | $19,593 | $22,346 |
| Standard Deviation (Population) | $19,511 | $21,832 |
Similar Demographics by Householder Income Ages 25 - 44 years
Demographics Similar to Czechs by Householder Income Ages 25 - 44 years
In terms of householder income ages 25 - 44 years, the demographic groups most similar to Czechs are South American Indian ($96,497, a difference of 0.030%), Slovene ($96,439, a difference of 0.090%), Ugandan ($96,667, a difference of 0.15%), Slavic ($96,377, a difference of 0.15%), and Basque ($96,709, a difference of 0.19%).
| Demographics | Rating | Rank | Householder Income Ages 25 - 44 years |
| Immigrants | Chile | 80.8 /100 | #144 | Excellent $97,159 |
| Norwegians | 78.2 /100 | #145 | Good $96,866 |
| Ethiopians | 77.8 /100 | #146 | Good $96,824 |
| Immigrants | Syria | 77.4 /100 | #147 | Good $96,789 |
| Irish | 76.9 /100 | #148 | Good $96,730 |
| Basques | 76.6 /100 | #149 | Good $96,709 |
| Ugandans | 76.2 /100 | #150 | Good $96,667 |
| Czechs | 74.8 /100 | #151 | Good $96,525 |
| South American Indians | 74.5 /100 | #152 | Good $96,497 |
| Slovenes | 73.9 /100 | #153 | Good $96,439 |
| Slavs | 73.2 /100 | #154 | Good $96,377 |
| Moroccans | 70.3 /100 | #155 | Good $96,117 |
| Immigrants | Germany | 67.9 /100 | #156 | Good $95,913 |
| Immigrants | Uganda | 65.2 /100 | #157 | Good $95,698 |
| Scandinavians | 63.9 /100 | #158 | Good $95,596 |
Demographics Similar to Cheyenne by Householder Income Ages 25 - 44 years
In terms of householder income ages 25 - 44 years, the demographic groups most similar to Cheyenne are Ottawa ($79,012, a difference of 0.18%), African ($78,986, a difference of 0.21%), Menominee ($79,358, a difference of 0.26%), Immigrants from Haiti ($79,391, a difference of 0.30%), and U.S. Virgin Islander ($78,911, a difference of 0.30%).
| Demographics | Rating | Rank | Householder Income Ages 25 - 44 years |
| Haitians | 0.0 /100 | #307 | Tragic $80,055 |
| Immigrants | Central America | 0.0 /100 | #308 | Tragic $80,012 |
| Chippewa | 0.0 /100 | #309 | Tragic $80,005 |
| Fijians | 0.0 /100 | #310 | Tragic $79,956 |
| Indonesians | 0.0 /100 | #311 | Tragic $79,543 |
| Immigrants | Haiti | 0.0 /100 | #312 | Tragic $79,391 |
| Menominee | 0.0 /100 | #313 | Tragic $79,358 |
| Cheyenne | 0.0 /100 | #314 | Tragic $79,152 |
| Ottawa | 0.0 /100 | #315 | Tragic $79,012 |
| Africans | 0.0 /100 | #316 | Tragic $78,986 |
| U.S. Virgin Islanders | 0.0 /100 | #317 | Tragic $78,911 |
| Immigrants | Mexico | 0.0 /100 | #318 | Tragic $78,809 |
| Hondurans | 0.0 /100 | #319 | Tragic $78,540 |
| Choctaw | 0.0 /100 | #320 | Tragic $78,168 |
| Immigrants | Zaire | 0.0 /100 | #321 | Tragic $78,045 |