Choctaw vs Immigrants from the Azores Householder Income Ages 45 - 64 years
COMPARE
Choctaw
Immigrants from the Azores
Householder Income Ages 45 - 64 years
Householder Income Ages 45 - 64 years Comparison
Choctaw
Immigrants from the Azores
$82,287
HOUSEHOLDER INCOME AGES 45 - 64 YEARS
0.0/ 100
METRIC RATING
318th/ 347
METRIC RANK
$94,138
HOUSEHOLDER INCOME AGES 45 - 64 YEARS
4.3/ 100
METRIC RATING
226th/ 347
METRIC RANK
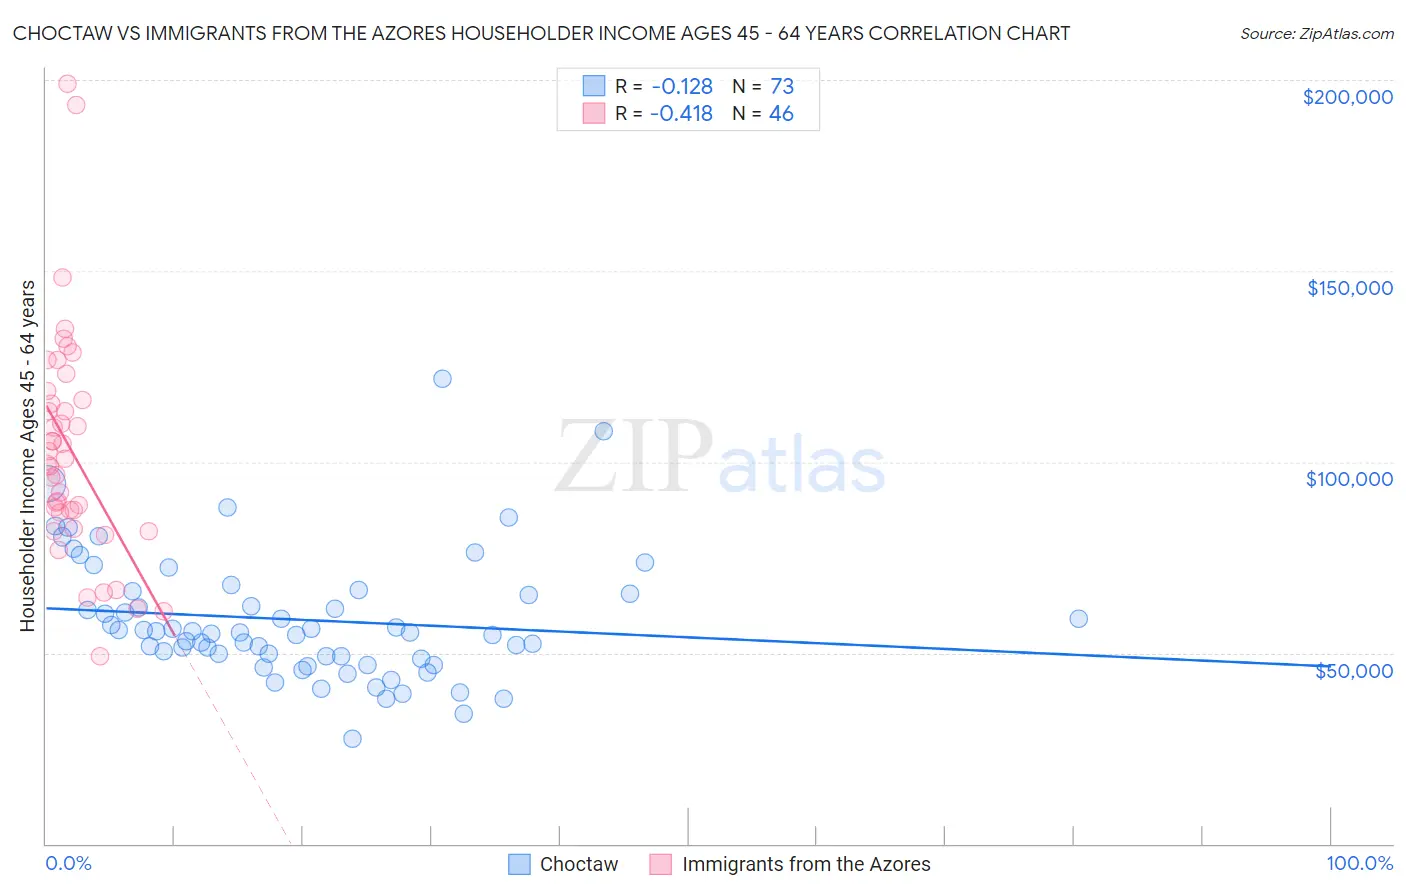
Choctaw vs Immigrants from the Azores Householder Income Ages 45 - 64 years Correlation Chart
The statistical analysis conducted on geographies consisting of 269,212,167 people shows a poor negative correlation between the proportion of Choctaw and household income with householder between the ages 45 and 64 in the United States with a correlation coefficient (R) of -0.128 and weighted average of $82,287. Similarly, the statistical analysis conducted on geographies consisting of 46,245,378 people shows a moderate negative correlation between the proportion of Immigrants from the Azores and household income with householder between the ages 45 and 64 in the United States with a correlation coefficient (R) of -0.418 and weighted average of $94,138, a difference of 14.4%.
Householder Income Ages 45 - 64 years Correlation Summary
| Measurement | Choctaw | Immigrants from the Azores |
| Minimum | $27,500 | $49,083 |
| Maximum | $121,667 | $198,981 |
| Range | $94,167 | $149,898 |
| Mean | $58,687 | $103,017 |
| Median | $55,469 | $100,003 |
| Interquartile 25% (IQ1) | $48,732 | $86,798 |
| Interquartile 75% (IQ3) | $65,840 | $116,103 |
| Interquartile Range (IQR) | $17,109 | $29,305 |
| Standard Deviation (Sample) | $16,580 | $29,838 |
| Standard Deviation (Population) | $16,466 | $29,512 |
Similar Demographics by Householder Income Ages 45 - 64 years
Demographics Similar to Choctaw by Householder Income Ages 45 - 64 years
In terms of householder income ages 45 - 64 years, the demographic groups most similar to Choctaw are Chickasaw ($82,193, a difference of 0.11%), Apache ($82,184, a difference of 0.13%), Yuman ($82,139, a difference of 0.18%), Colville ($82,474, a difference of 0.23%), and Immigrants from Caribbean ($82,513, a difference of 0.28%).
| Demographics | Rating | Rank | Householder Income Ages 45 - 64 years |
| Immigrants | Bahamas | 0.0 /100 | #311 | Tragic $83,177 |
| Cajuns | 0.0 /100 | #312 | Tragic $83,015 |
| U.S. Virgin Islanders | 0.0 /100 | #313 | Tragic $82,736 |
| Immigrants | Honduras | 0.0 /100 | #314 | Tragic $82,697 |
| Paiute | 0.0 /100 | #315 | Tragic $82,629 |
| Immigrants | Caribbean | 0.0 /100 | #316 | Tragic $82,513 |
| Colville | 0.0 /100 | #317 | Tragic $82,474 |
| Choctaw | 0.0 /100 | #318 | Tragic $82,287 |
| Chickasaw | 0.0 /100 | #319 | Tragic $82,193 |
| Apache | 0.0 /100 | #320 | Tragic $82,184 |
| Yuman | 0.0 /100 | #321 | Tragic $82,139 |
| Sioux | 0.0 /100 | #322 | Tragic $81,750 |
| Bahamians | 0.0 /100 | #323 | Tragic $81,369 |
| Yup'ik | 0.0 /100 | #324 | Tragic $81,000 |
| Immigrants | Cuba | 0.0 /100 | #325 | Tragic $80,662 |
Demographics Similar to Immigrants from the Azores by Householder Income Ages 45 - 64 years
In terms of householder income ages 45 - 64 years, the demographic groups most similar to Immigrants from the Azores are Bermudan ($94,197, a difference of 0.060%), Immigrants from Bosnia and Herzegovina ($94,288, a difference of 0.16%), Alaska Native ($93,991, a difference of 0.16%), Nonimmigrants ($94,448, a difference of 0.33%), and Immigrants from Panama ($93,815, a difference of 0.34%).
| Demographics | Rating | Rank | Householder Income Ages 45 - 64 years |
| Immigrants | Armenia | 6.1 /100 | #219 | Tragic $94,863 |
| Salvadorans | 6.0 /100 | #220 | Tragic $94,842 |
| Immigrants | Nigeria | 5.9 /100 | #221 | Tragic $94,804 |
| Malaysians | 5.2 /100 | #222 | Tragic $94,517 |
| Immigrants | Nonimmigrants | 5.0 /100 | #223 | Tragic $94,448 |
| Immigrants | Bosnia and Herzegovina | 4.6 /100 | #224 | Tragic $94,288 |
| Bermudans | 4.4 /100 | #225 | Tragic $94,197 |
| Immigrants | Azores | 4.3 /100 | #226 | Tragic $94,138 |
| Alaska Natives | 4.0 /100 | #227 | Tragic $93,991 |
| Immigrants | Panama | 3.7 /100 | #228 | Tragic $93,815 |
| Vietnamese | 3.6 /100 | #229 | Tragic $93,788 |
| Immigrants | Sudan | 3.6 /100 | #230 | Tragic $93,781 |
| Ecuadorians | 3.6 /100 | #231 | Tragic $93,739 |
| Sudanese | 3.5 /100 | #232 | Tragic $93,718 |
| Nepalese | 3.0 /100 | #233 | Tragic $93,355 |