Choctaw vs African Householder Income Ages 45 - 64 years
COMPARE
Choctaw
African
Householder Income Ages 45 - 64 years
Householder Income Ages 45 - 64 years Comparison
Choctaw
Africans
$82,287
HOUSEHOLDER INCOME AGES 45 - 64 YEARS
0.0/ 100
METRIC RATING
318th/ 347
METRIC RANK
$84,925
HOUSEHOLDER INCOME AGES 45 - 64 YEARS
0.0/ 100
METRIC RATING
298th/ 347
METRIC RANK
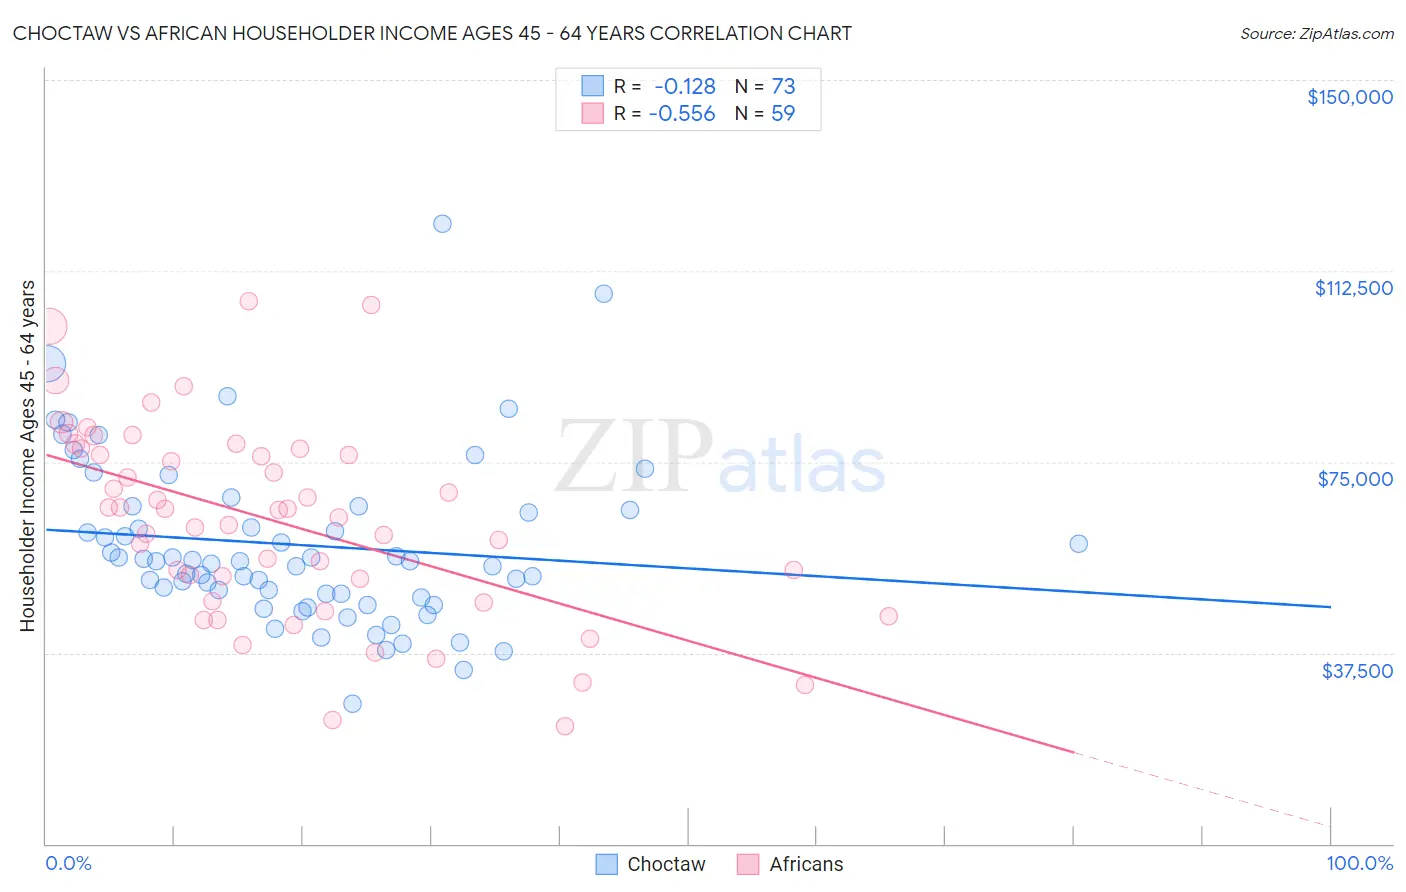
Choctaw vs African Householder Income Ages 45 - 64 years Correlation Chart
The statistical analysis conducted on geographies consisting of 269,212,167 people shows a poor negative correlation between the proportion of Choctaw and household income with householder between the ages 45 and 64 in the United States with a correlation coefficient (R) of -0.128 and weighted average of $82,287. Similarly, the statistical analysis conducted on geographies consisting of 468,468,488 people shows a substantial negative correlation between the proportion of Africans and household income with householder between the ages 45 and 64 in the United States with a correlation coefficient (R) of -0.556 and weighted average of $84,925, a difference of 3.2%.
Householder Income Ages 45 - 64 years Correlation Summary
| Measurement | Choctaw | African |
| Minimum | $27,500 | $23,133 |
| Maximum | $121,667 | $106,630 |
| Range | $94,167 | $83,497 |
| Mean | $58,687 | $63,321 |
| Median | $55,469 | $65,668 |
| Interquartile 25% (IQ1) | $48,732 | $47,695 |
| Interquartile 75% (IQ3) | $65,840 | $77,568 |
| Interquartile Range (IQR) | $17,109 | $29,873 |
| Standard Deviation (Sample) | $16,580 | $19,169 |
| Standard Deviation (Population) | $16,466 | $19,006 |
Demographics Similar to Choctaw and Africans by Householder Income Ages 45 - 64 years
In terms of householder income ages 45 - 64 years, the demographic groups most similar to Choctaw are Colville ($82,474, a difference of 0.23%), Immigrants from Caribbean ($82,513, a difference of 0.28%), Paiute ($82,629, a difference of 0.42%), Immigrants from Honduras ($82,697, a difference of 0.50%), and U.S. Virgin Islander ($82,736, a difference of 0.55%). Similarly, the demographic groups most similar to Africans are Immigrants from Mexico ($84,910, a difference of 0.020%), Indonesian ($84,890, a difference of 0.040%), Potawatomi ($84,613, a difference of 0.37%), Haitian ($84,384, a difference of 0.64%), and Honduran ($84,079, a difference of 1.0%).
| Demographics | Rating | Rank | Householder Income Ages 45 - 64 years |
| Africans | 0.0 /100 | #298 | Tragic $84,925 |
| Immigrants | Mexico | 0.0 /100 | #299 | Tragic $84,910 |
| Indonesians | 0.0 /100 | #300 | Tragic $84,890 |
| Potawatomi | 0.0 /100 | #301 | Tragic $84,613 |
| Haitians | 0.0 /100 | #302 | Tragic $84,384 |
| Hondurans | 0.0 /100 | #303 | Tragic $84,079 |
| Ottawa | 0.0 /100 | #304 | Tragic $83,953 |
| Chippewa | 0.0 /100 | #305 | Tragic $83,943 |
| Ute | 0.0 /100 | #306 | Tragic $83,937 |
| Shoshone | 0.0 /100 | #307 | Tragic $83,588 |
| Immigrants | Cabo Verde | 0.0 /100 | #308 | Tragic $83,542 |
| Immigrants | Dominica | 0.0 /100 | #309 | Tragic $83,311 |
| Immigrants | Haiti | 0.0 /100 | #310 | Tragic $83,257 |
| Immigrants | Bahamas | 0.0 /100 | #311 | Tragic $83,177 |
| Cajuns | 0.0 /100 | #312 | Tragic $83,015 |
| U.S. Virgin Islanders | 0.0 /100 | #313 | Tragic $82,736 |
| Immigrants | Honduras | 0.0 /100 | #314 | Tragic $82,697 |
| Paiute | 0.0 /100 | #315 | Tragic $82,629 |
| Immigrants | Caribbean | 0.0 /100 | #316 | Tragic $82,513 |
| Colville | 0.0 /100 | #317 | Tragic $82,474 |
| Choctaw | 0.0 /100 | #318 | Tragic $82,287 |