Choctaw vs Italian Householder Income Ages 45 - 64 years
COMPARE
Choctaw
Italian
Householder Income Ages 45 - 64 years
Householder Income Ages 45 - 64 years Comparison
Choctaw
Italians
$82,287
HOUSEHOLDER INCOME AGES 45 - 64 YEARS
0.0/ 100
METRIC RATING
318th/ 347
METRIC RANK
$110,224
HOUSEHOLDER INCOME AGES 45 - 64 YEARS
99.3/ 100
METRIC RATING
71st/ 347
METRIC RANK
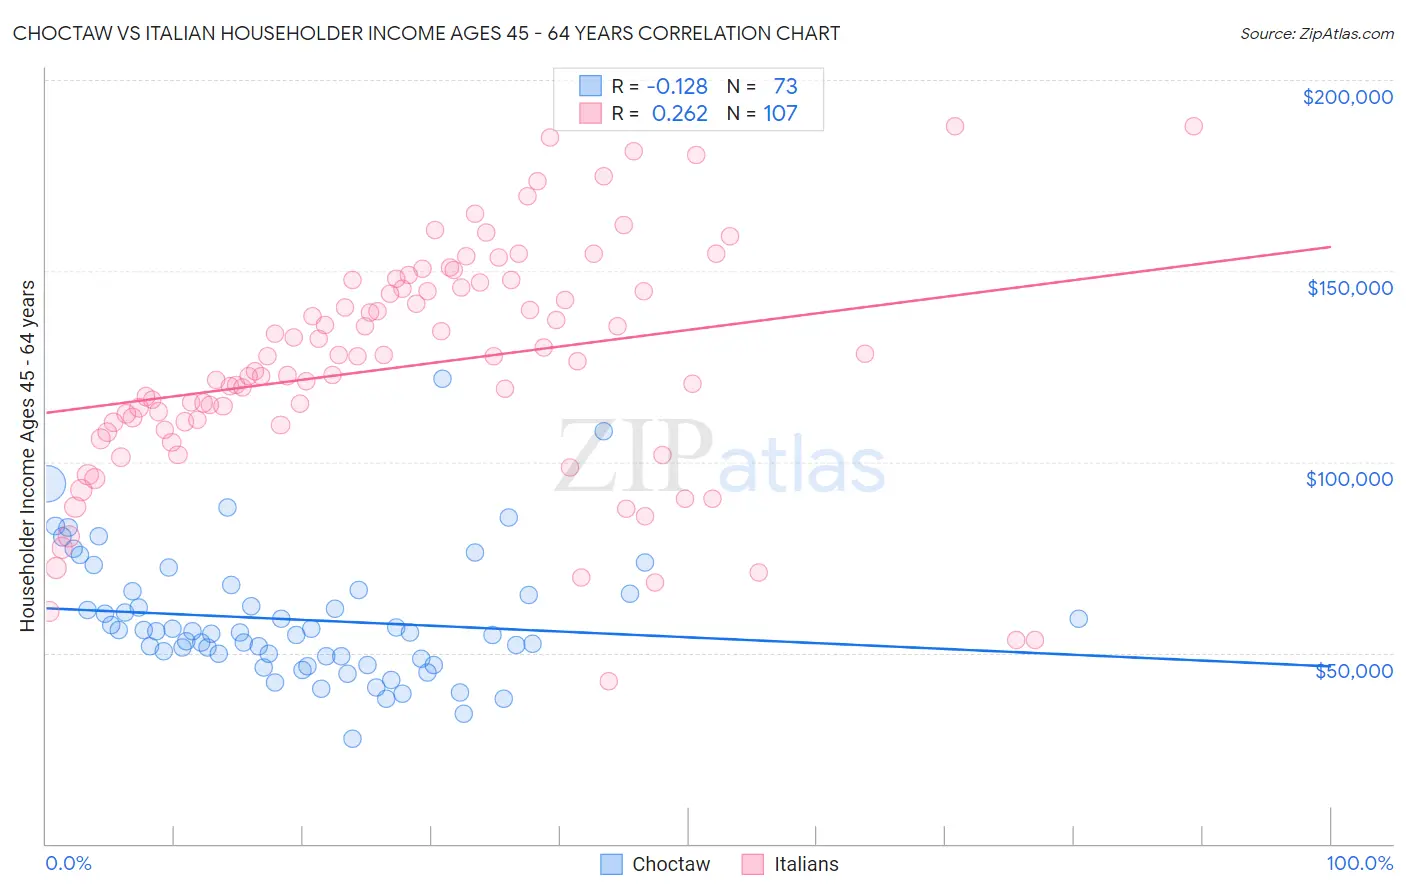
Choctaw vs Italian Householder Income Ages 45 - 64 years Correlation Chart
The statistical analysis conducted on geographies consisting of 269,212,167 people shows a poor negative correlation between the proportion of Choctaw and household income with householder between the ages 45 and 64 in the United States with a correlation coefficient (R) of -0.128 and weighted average of $82,287. Similarly, the statistical analysis conducted on geographies consisting of 571,010,703 people shows a weak positive correlation between the proportion of Italians and household income with householder between the ages 45 and 64 in the United States with a correlation coefficient (R) of 0.262 and weighted average of $110,224, a difference of 34.0%.
Householder Income Ages 45 - 64 years Correlation Summary
| Measurement | Choctaw | Italian |
| Minimum | $27,500 | $42,562 |
| Maximum | $121,667 | $188,030 |
| Range | $94,167 | $145,468 |
| Mean | $58,687 | $125,039 |
| Median | $55,469 | $126,199 |
| Interquartile 25% (IQ1) | $48,732 | $109,794 |
| Interquartile 75% (IQ3) | $65,840 | $145,518 |
| Interquartile Range (IQR) | $17,109 | $35,724 |
| Standard Deviation (Sample) | $16,580 | $30,277 |
| Standard Deviation (Population) | $16,466 | $30,135 |
Similar Demographics by Householder Income Ages 45 - 64 years
Demographics Similar to Choctaw by Householder Income Ages 45 - 64 years
In terms of householder income ages 45 - 64 years, the demographic groups most similar to Choctaw are Chickasaw ($82,193, a difference of 0.11%), Apache ($82,184, a difference of 0.13%), Yuman ($82,139, a difference of 0.18%), Colville ($82,474, a difference of 0.23%), and Immigrants from Caribbean ($82,513, a difference of 0.28%).
| Demographics | Rating | Rank | Householder Income Ages 45 - 64 years |
| Immigrants | Bahamas | 0.0 /100 | #311 | Tragic $83,177 |
| Cajuns | 0.0 /100 | #312 | Tragic $83,015 |
| U.S. Virgin Islanders | 0.0 /100 | #313 | Tragic $82,736 |
| Immigrants | Honduras | 0.0 /100 | #314 | Tragic $82,697 |
| Paiute | 0.0 /100 | #315 | Tragic $82,629 |
| Immigrants | Caribbean | 0.0 /100 | #316 | Tragic $82,513 |
| Colville | 0.0 /100 | #317 | Tragic $82,474 |
| Choctaw | 0.0 /100 | #318 | Tragic $82,287 |
| Chickasaw | 0.0 /100 | #319 | Tragic $82,193 |
| Apache | 0.0 /100 | #320 | Tragic $82,184 |
| Yuman | 0.0 /100 | #321 | Tragic $82,139 |
| Sioux | 0.0 /100 | #322 | Tragic $81,750 |
| Bahamians | 0.0 /100 | #323 | Tragic $81,369 |
| Yup'ik | 0.0 /100 | #324 | Tragic $81,000 |
| Immigrants | Cuba | 0.0 /100 | #325 | Tragic $80,662 |
Demographics Similar to Italians by Householder Income Ages 45 - 64 years
In terms of householder income ages 45 - 64 years, the demographic groups most similar to Italians are Assyrian/Chaldean/Syriac ($110,201, a difference of 0.020%), Korean ($110,334, a difference of 0.10%), Argentinean ($110,103, a difference of 0.11%), Immigrants from Italy ($110,434, a difference of 0.19%), and Immigrants from Egypt ($109,941, a difference of 0.26%).
| Demographics | Rating | Rank | Householder Income Ages 45 - 64 years |
| Immigrants | Latvia | 99.6 /100 | #64 | Exceptional $111,454 |
| Immigrants | Belarus | 99.6 /100 | #65 | Exceptional $111,430 |
| New Zealanders | 99.6 /100 | #66 | Exceptional $111,286 |
| Laotians | 99.5 /100 | #67 | Exceptional $111,051 |
| Immigrants | Romania | 99.4 /100 | #68 | Exceptional $110,633 |
| Immigrants | Italy | 99.4 /100 | #69 | Exceptional $110,434 |
| Koreans | 99.3 /100 | #70 | Exceptional $110,334 |
| Italians | 99.3 /100 | #71 | Exceptional $110,224 |
| Assyrians/Chaldeans/Syriacs | 99.3 /100 | #72 | Exceptional $110,201 |
| Argentineans | 99.3 /100 | #73 | Exceptional $110,103 |
| Immigrants | Egypt | 99.2 /100 | #74 | Exceptional $109,941 |
| South Africans | 99.1 /100 | #75 | Exceptional $109,719 |
| Paraguayans | 99.0 /100 | #76 | Exceptional $109,447 |
| Immigrants | England | 99.0 /100 | #77 | Exceptional $109,446 |
| Immigrants | Canada | 99.0 /100 | #78 | Exceptional $109,402 |