Sri Lankan vs Immigrants from the Azores Householder Income Ages 45 - 64 years
COMPARE
Sri Lankan
Immigrants from the Azores
Householder Income Ages 45 - 64 years
Householder Income Ages 45 - 64 years Comparison
Sri Lankans
Immigrants from the Azores
$108,270
HOUSEHOLDER INCOME AGES 45 - 64 YEARS
98.2/ 100
METRIC RATING
94th/ 347
METRIC RANK
$94,138
HOUSEHOLDER INCOME AGES 45 - 64 YEARS
4.3/ 100
METRIC RATING
226th/ 347
METRIC RANK
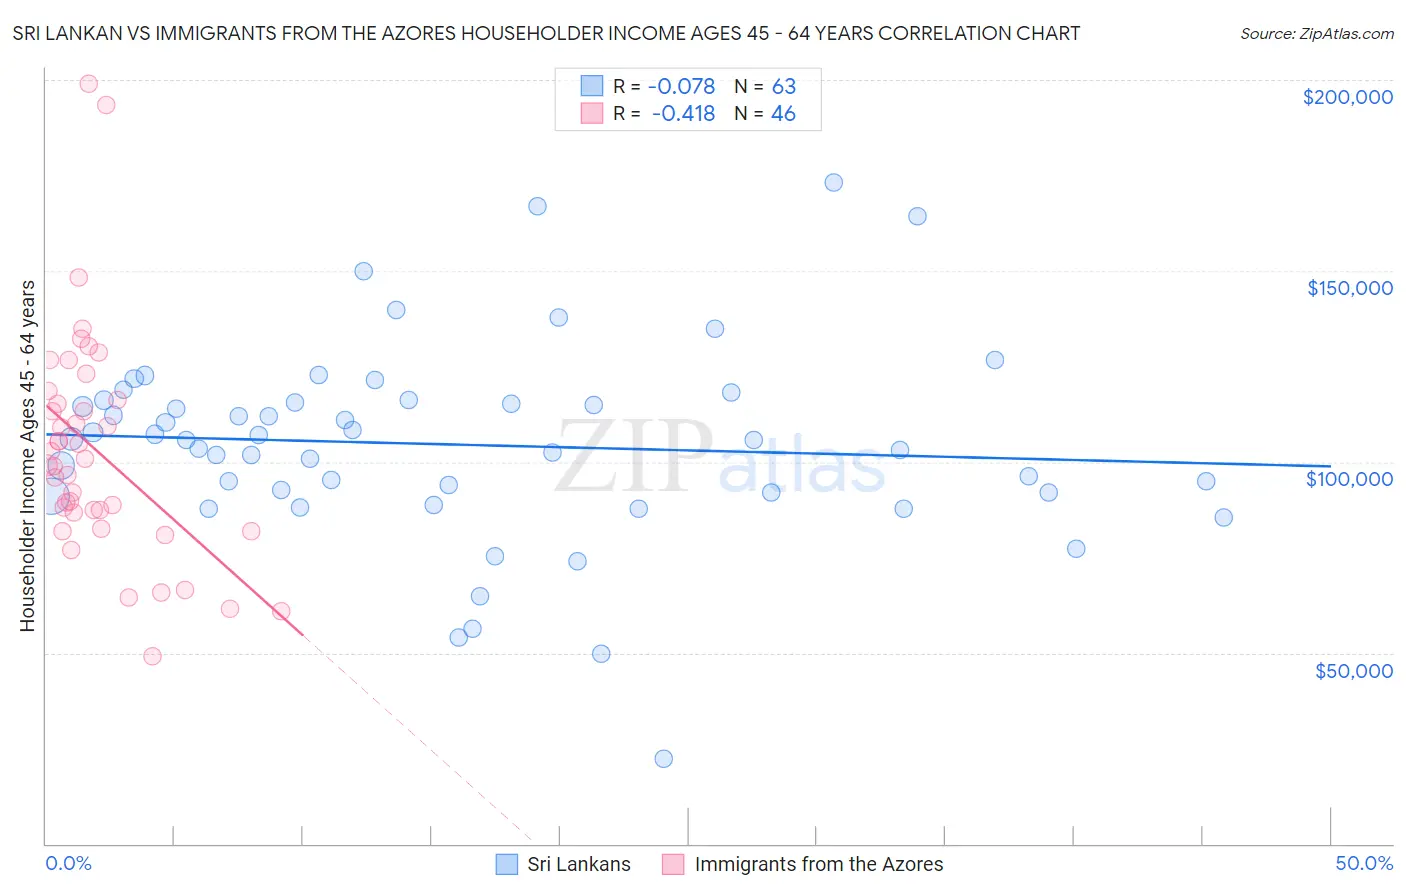
Sri Lankan vs Immigrants from the Azores Householder Income Ages 45 - 64 years Correlation Chart
The statistical analysis conducted on geographies consisting of 439,428,647 people shows a slight negative correlation between the proportion of Sri Lankans and household income with householder between the ages 45 and 64 in the United States with a correlation coefficient (R) of -0.078 and weighted average of $108,270. Similarly, the statistical analysis conducted on geographies consisting of 46,245,378 people shows a moderate negative correlation between the proportion of Immigrants from the Azores and household income with householder between the ages 45 and 64 in the United States with a correlation coefficient (R) of -0.418 and weighted average of $94,138, a difference of 15.0%.
Householder Income Ages 45 - 64 years Correlation Summary
| Measurement | Sri Lankan | Immigrants from the Azores |
| Minimum | $22,321 | $49,083 |
| Maximum | $173,169 | $198,981 |
| Range | $150,848 | $149,898 |
| Mean | $104,535 | $103,017 |
| Median | $105,686 | $100,003 |
| Interquartile 25% (IQ1) | $91,849 | $86,798 |
| Interquartile 75% (IQ3) | $116,139 | $116,103 |
| Interquartile Range (IQR) | $24,290 | $29,305 |
| Standard Deviation (Sample) | $26,133 | $29,838 |
| Standard Deviation (Population) | $25,925 | $29,512 |
Similar Demographics by Householder Income Ages 45 - 64 years
Demographics Similar to Sri Lankans by Householder Income Ages 45 - 64 years
In terms of householder income ages 45 - 64 years, the demographic groups most similar to Sri Lankans are Immigrants from Hungary ($108,267, a difference of 0.0%), Immigrants from Argentina ($108,264, a difference of 0.010%), Immigrants from Croatia ($108,304, a difference of 0.030%), Croatian ($108,383, a difference of 0.10%), and Ukrainian ($108,475, a difference of 0.19%).
| Demographics | Rating | Rank | Householder Income Ages 45 - 64 years |
| Tongans | 98.5 /100 | #87 | Exceptional $108,643 |
| Romanians | 98.5 /100 | #88 | Exceptional $108,609 |
| Ukrainians | 98.3 /100 | #89 | Exceptional $108,475 |
| Immigrants | Philippines | 98.3 /100 | #90 | Exceptional $108,471 |
| Immigrants | Lebanon | 98.3 /100 | #91 | Exceptional $108,471 |
| Croatians | 98.3 /100 | #92 | Exceptional $108,383 |
| Immigrants | Croatia | 98.2 /100 | #93 | Exceptional $108,304 |
| Sri Lankans | 98.2 /100 | #94 | Exceptional $108,270 |
| Immigrants | Hungary | 98.2 /100 | #95 | Exceptional $108,267 |
| Immigrants | Argentina | 98.2 /100 | #96 | Exceptional $108,264 |
| Northern Europeans | 97.8 /100 | #97 | Exceptional $107,870 |
| Immigrants | Southern Europe | 97.7 /100 | #98 | Exceptional $107,775 |
| Palestinians | 97.6 /100 | #99 | Exceptional $107,721 |
| Immigrants | Serbia | 97.4 /100 | #100 | Exceptional $107,569 |
| Immigrants | Kazakhstan | 97.2 /100 | #101 | Exceptional $107,378 |
Demographics Similar to Immigrants from the Azores by Householder Income Ages 45 - 64 years
In terms of householder income ages 45 - 64 years, the demographic groups most similar to Immigrants from the Azores are Bermudan ($94,197, a difference of 0.060%), Immigrants from Bosnia and Herzegovina ($94,288, a difference of 0.16%), Alaska Native ($93,991, a difference of 0.16%), Nonimmigrants ($94,448, a difference of 0.33%), and Immigrants from Panama ($93,815, a difference of 0.34%).
| Demographics | Rating | Rank | Householder Income Ages 45 - 64 years |
| Immigrants | Armenia | 6.1 /100 | #219 | Tragic $94,863 |
| Salvadorans | 6.0 /100 | #220 | Tragic $94,842 |
| Immigrants | Nigeria | 5.9 /100 | #221 | Tragic $94,804 |
| Malaysians | 5.2 /100 | #222 | Tragic $94,517 |
| Immigrants | Nonimmigrants | 5.0 /100 | #223 | Tragic $94,448 |
| Immigrants | Bosnia and Herzegovina | 4.6 /100 | #224 | Tragic $94,288 |
| Bermudans | 4.4 /100 | #225 | Tragic $94,197 |
| Immigrants | Azores | 4.3 /100 | #226 | Tragic $94,138 |
| Alaska Natives | 4.0 /100 | #227 | Tragic $93,991 |
| Immigrants | Panama | 3.7 /100 | #228 | Tragic $93,815 |
| Vietnamese | 3.6 /100 | #229 | Tragic $93,788 |
| Immigrants | Sudan | 3.6 /100 | #230 | Tragic $93,781 |
| Ecuadorians | 3.6 /100 | #231 | Tragic $93,739 |
| Sudanese | 3.5 /100 | #232 | Tragic $93,718 |
| Nepalese | 3.0 /100 | #233 | Tragic $93,355 |