Choctaw vs Immigrants from the Azores Average Family Size
COMPARE
Choctaw
Immigrants from the Azores
Average Family Size
Average Family Size Comparison
Choctaw
Immigrants from the Azores
3.21
AVERAGE FAMILY SIZE
28.3/ 100
METRIC RATING
195th/ 347
METRIC RANK
3.21
AVERAGE FAMILY SIZE
21.7/ 100
METRIC RATING
198th/ 347
METRIC RANK
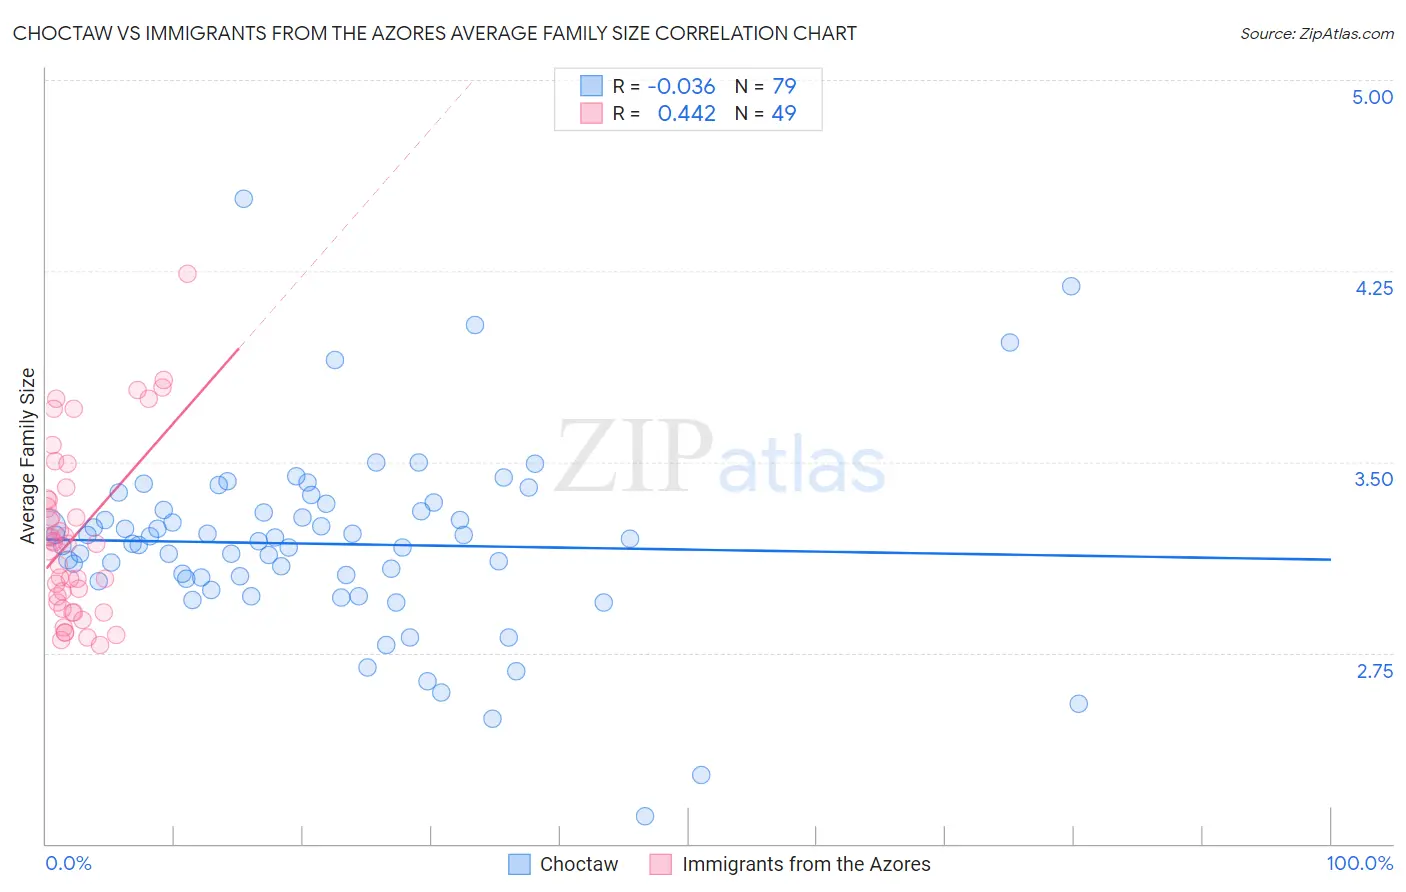
Choctaw vs Immigrants from the Azores Average Family Size Correlation Chart
The statistical analysis conducted on geographies consisting of 269,626,906 people shows no correlation between the proportion of Choctaw and average family size in the United States with a correlation coefficient (R) of -0.036 and weighted average of 3.21. Similarly, the statistical analysis conducted on geographies consisting of 46,257,310 people shows a moderate positive correlation between the proportion of Immigrants from the Azores and average family size in the United States with a correlation coefficient (R) of 0.442 and weighted average of 3.21, a difference of 0.16%.
Average Family Size Correlation Summary
| Measurement | Choctaw | Immigrants from the Azores |
| Minimum | 2.11 | 2.78 |
| Maximum | 4.53 | 4.24 |
| Range | 2.42 | 1.46 |
| Mean | 3.18 | 3.22 |
| Median | 3.19 | 3.18 |
| Interquartile 25% (IQ1) | 3.04 | 2.93 |
| Interquartile 75% (IQ3) | 3.31 | 3.38 |
| Interquartile Range (IQR) | 0.27 | 0.44 |
| Standard Deviation (Sample) | 0.37 | 0.34 |
| Standard Deviation (Population) | 0.37 | 0.34 |
Demographics Similar to Choctaw and Immigrants from the Azores by Average Family Size
In terms of average family size, the demographic groups most similar to Choctaw are Senegalese (3.21, a difference of 0.0%), Kenyan (3.21, a difference of 0.010%), Immigrants from Israel (3.22, a difference of 0.020%), Immigrants from Sudan (3.22, a difference of 0.020%), and Immigrants from Eastern Africa (3.22, a difference of 0.040%). Similarly, the demographic groups most similar to Immigrants from the Azores are Hmong (3.21, a difference of 0.020%), Immigrants from Kenya (3.21, a difference of 0.070%), Immigrants from Morocco (3.21, a difference of 0.090%), Immigrants from India (3.21, a difference of 0.090%), and Immigrants from Nepal (3.21, a difference of 0.10%).
| Demographics | Rating | Rank | Average Family Size |
| Immigrants | Argentina | 39.8 /100 | #186 | Fair 3.22 |
| Immigrants | Malaysia | 39.0 /100 | #187 | Fair 3.22 |
| Thais | 38.3 /100 | #188 | Fair 3.22 |
| Pakistanis | 33.7 /100 | #189 | Fair 3.22 |
| Burmese | 31.0 /100 | #190 | Fair 3.22 |
| Immigrants | Zaire | 30.5 /100 | #191 | Fair 3.22 |
| Immigrants | Eastern Africa | 30.1 /100 | #192 | Fair 3.22 |
| Immigrants | Israel | 29.3 /100 | #193 | Fair 3.22 |
| Immigrants | Sudan | 29.1 /100 | #194 | Fair 3.22 |
| Choctaw | 28.3 /100 | #195 | Fair 3.21 |
| Senegalese | 28.2 /100 | #196 | Fair 3.21 |
| Kenyans | 28.0 /100 | #197 | Fair 3.21 |
| Immigrants | Azores | 21.7 /100 | #198 | Fair 3.21 |
| Hmong | 20.7 /100 | #199 | Fair 3.21 |
| Immigrants | Kenya | 19.2 /100 | #200 | Poor 3.21 |
| Immigrants | Morocco | 18.5 /100 | #201 | Poor 3.21 |
| Immigrants | India | 18.5 /100 | #202 | Poor 3.21 |
| Immigrants | Nepal | 18.1 /100 | #203 | Poor 3.21 |
| Immigrants | Poland | 16.6 /100 | #204 | Poor 3.20 |
| Paraguayans | 16.3 /100 | #205 | Poor 3.20 |
| Immigrants | Cabo Verde | 16.0 /100 | #206 | Poor 3.20 |