Immigrants from Spain vs Macedonian Median Male Earnings
COMPARE
Immigrants from Spain
Macedonian
Median Male Earnings
Median Male Earnings Comparison
Immigrants from Spain
Macedonians
$60,750
MEDIAN MALE EARNINGS
99.8/ 100
METRIC RATING
67th/ 347
METRIC RANK
$59,522
MEDIAN MALE EARNINGS
99.3/ 100
METRIC RATING
87th/ 347
METRIC RANK
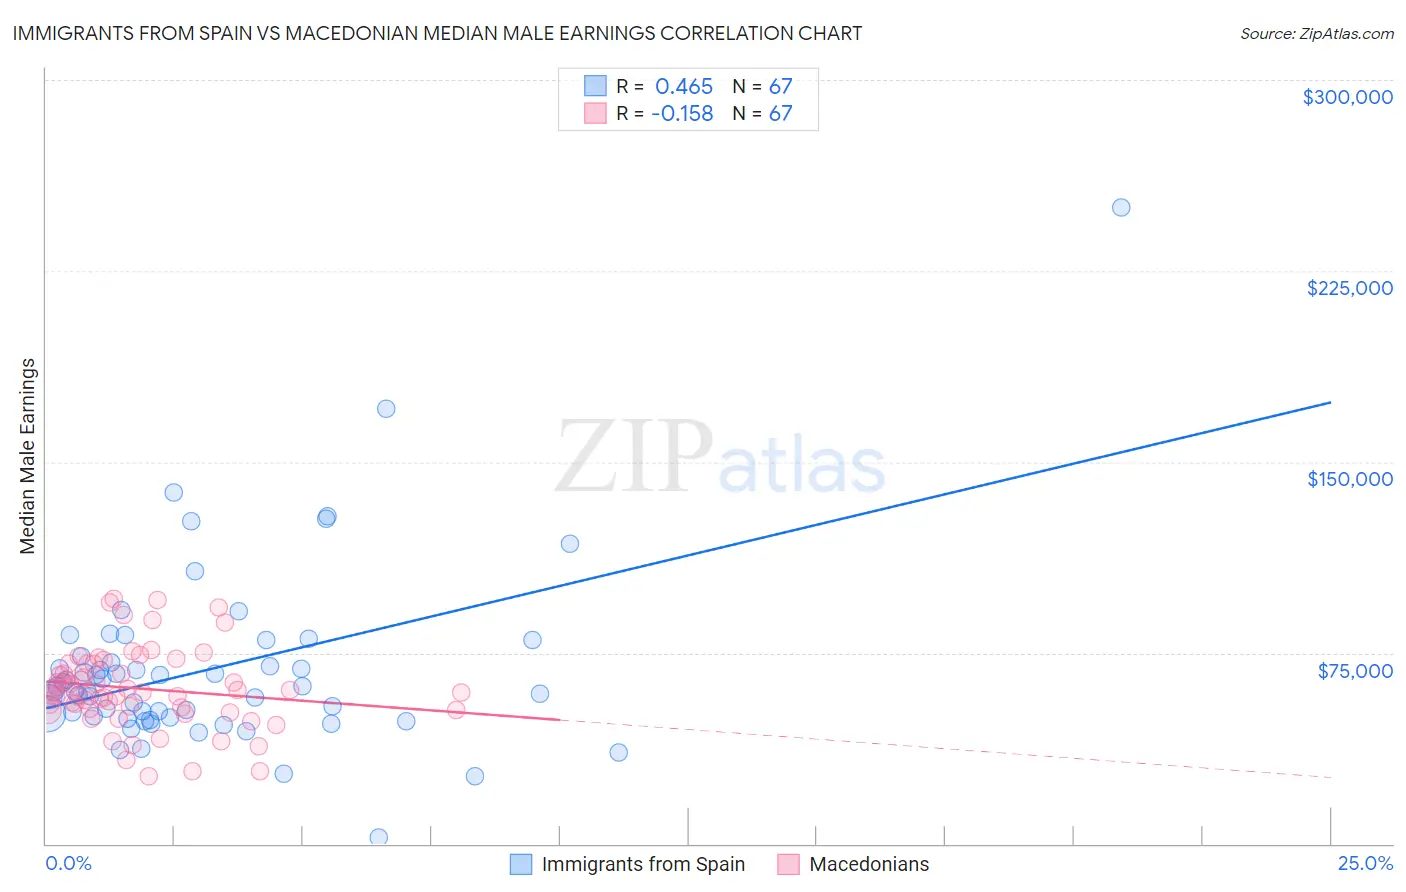
Immigrants from Spain vs Macedonian Median Male Earnings Correlation Chart
The statistical analysis conducted on geographies consisting of 239,649,237 people shows a moderate positive correlation between the proportion of Immigrants from Spain and median male earnings in the United States with a correlation coefficient (R) of 0.465 and weighted average of $60,750. Similarly, the statistical analysis conducted on geographies consisting of 132,576,101 people shows a poor negative correlation between the proportion of Macedonians and median male earnings in the United States with a correlation coefficient (R) of -0.158 and weighted average of $59,522, a difference of 2.1%.
Median Male Earnings Correlation Summary
| Measurement | Immigrants from Spain | Macedonian |
| Minimum | $2,499 | $26,375 |
| Maximum | $250,001 | $96,230 |
| Range | $247,502 | $69,855 |
| Mean | $68,720 | $60,888 |
| Median | $60,260 | $59,610 |
| Interquartile 25% (IQ1) | $49,576 | $52,559 |
| Interquartile 75% (IQ3) | $73,651 | $70,744 |
| Interquartile Range (IQR) | $24,075 | $18,185 |
| Standard Deviation (Sample) | $35,640 | $15,733 |
| Standard Deviation (Population) | $35,373 | $15,615 |
Demographics Similar to Immigrants from Spain and Macedonians by Median Male Earnings
In terms of median male earnings, the demographic groups most similar to Immigrants from Spain are Immigrants from Serbia ($60,600, a difference of 0.25%), Immigrants from Canada ($60,388, a difference of 0.60%), Immigrants from Bulgaria ($60,358, a difference of 0.65%), Mongolian ($60,350, a difference of 0.66%), and Immigrants from Western Europe ($60,334, a difference of 0.69%). Similarly, the demographic groups most similar to Macedonians are Immigrants from England ($59,527, a difference of 0.010%), Afghan ($59,554, a difference of 0.050%), Italian ($59,551, a difference of 0.050%), Immigrants from Italy ($59,691, a difference of 0.29%), and Croatian ($59,715, a difference of 0.32%).
| Demographics | Rating | Rank | Median Male Earnings |
| Immigrants | Spain | 99.8 /100 | #67 | Exceptional $60,750 |
| Immigrants | Serbia | 99.7 /100 | #68 | Exceptional $60,600 |
| Immigrants | Canada | 99.7 /100 | #69 | Exceptional $60,388 |
| Immigrants | Bulgaria | 99.7 /100 | #70 | Exceptional $60,358 |
| Mongolians | 99.7 /100 | #71 | Exceptional $60,350 |
| Immigrants | Western Europe | 99.7 /100 | #72 | Exceptional $60,334 |
| Immigrants | North America | 99.7 /100 | #73 | Exceptional $60,265 |
| Argentineans | 99.6 /100 | #74 | Exceptional $60,117 |
| Immigrants | Bolivia | 99.6 /100 | #75 | Exceptional $60,088 |
| Romanians | 99.6 /100 | #76 | Exceptional $60,063 |
| Paraguayans | 99.5 /100 | #77 | Exceptional $59,975 |
| Immigrants | Egypt | 99.5 /100 | #78 | Exceptional $59,925 |
| Immigrants | Ukraine | 99.5 /100 | #79 | Exceptional $59,820 |
| Immigrants | Hungary | 99.5 /100 | #80 | Exceptional $59,806 |
| Ukrainians | 99.4 /100 | #81 | Exceptional $59,728 |
| Croatians | 99.4 /100 | #82 | Exceptional $59,715 |
| Immigrants | Italy | 99.4 /100 | #83 | Exceptional $59,691 |
| Afghans | 99.3 /100 | #84 | Exceptional $59,554 |
| Italians | 99.3 /100 | #85 | Exceptional $59,551 |
| Immigrants | England | 99.3 /100 | #86 | Exceptional $59,527 |
| Macedonians | 99.3 /100 | #87 | Exceptional $59,522 |