Native Hawaiian vs Macedonian Median Male Earnings
COMPARE
Native Hawaiian
Macedonian
Median Male Earnings
Median Male Earnings Comparison
Native Hawaiians
Macedonians
$52,306
MEDIAN MALE EARNINGS
10.5/ 100
METRIC RATING
213th/ 347
METRIC RANK
$59,522
MEDIAN MALE EARNINGS
99.3/ 100
METRIC RATING
87th/ 347
METRIC RANK
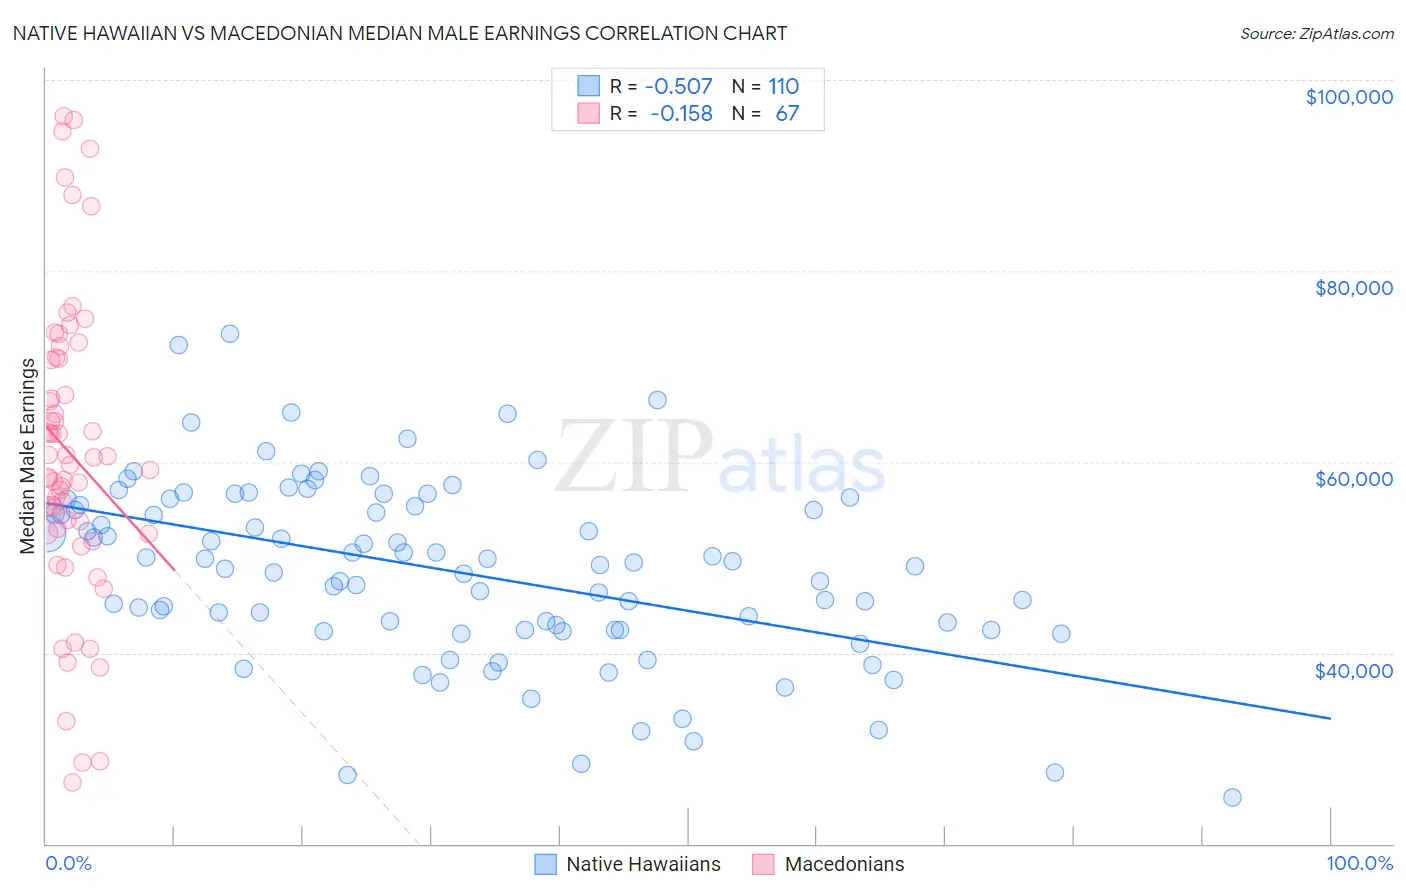
Native Hawaiian vs Macedonian Median Male Earnings Correlation Chart
The statistical analysis conducted on geographies consisting of 332,009,259 people shows a substantial negative correlation between the proportion of Native Hawaiians and median male earnings in the United States with a correlation coefficient (R) of -0.507 and weighted average of $52,306. Similarly, the statistical analysis conducted on geographies consisting of 132,576,101 people shows a poor negative correlation between the proportion of Macedonians and median male earnings in the United States with a correlation coefficient (R) of -0.158 and weighted average of $59,522, a difference of 13.8%.
Median Male Earnings Correlation Summary
| Measurement | Native Hawaiian | Macedonian |
| Minimum | $24,830 | $26,375 |
| Maximum | $73,412 | $96,230 |
| Range | $48,582 | $69,855 |
| Mean | $48,621 | $60,888 |
| Median | $49,328 | $59,610 |
| Interquartile 25% (IQ1) | $42,387 | $52,559 |
| Interquartile 75% (IQ3) | $55,422 | $70,744 |
| Interquartile Range (IQR) | $13,035 | $18,185 |
| Standard Deviation (Sample) | $9,458 | $15,733 |
| Standard Deviation (Population) | $9,414 | $15,615 |
Similar Demographics by Median Male Earnings
Demographics Similar to Native Hawaiians by Median Male Earnings
In terms of median male earnings, the demographic groups most similar to Native Hawaiians are Cajun ($52,325, a difference of 0.040%), Delaware ($52,412, a difference of 0.20%), Tlingit-Haida ($52,409, a difference of 0.20%), Nonimmigrants ($52,170, a difference of 0.26%), and Bermudan ($52,465, a difference of 0.30%).
| Demographics | Rating | Rank | Median Male Earnings |
| Immigrants | Iraq | 14.5 /100 | #206 | Poor $52,681 |
| Vietnamese | 12.7 /100 | #207 | Poor $52,525 |
| Venezuelans | 12.5 /100 | #208 | Poor $52,510 |
| Bermudans | 12.1 /100 | #209 | Poor $52,465 |
| Delaware | 11.5 /100 | #210 | Poor $52,412 |
| Tlingit-Haida | 11.5 /100 | #211 | Poor $52,409 |
| Cajuns | 10.7 /100 | #212 | Poor $52,325 |
| Native Hawaiians | 10.5 /100 | #213 | Poor $52,306 |
| Immigrants | Nonimmigrants | 9.3 /100 | #214 | Tragic $52,170 |
| Immigrants | Cameroon | 8.9 /100 | #215 | Tragic $52,119 |
| Immigrants | Venezuela | 8.3 /100 | #216 | Tragic $52,041 |
| Nigerians | 8.3 /100 | #217 | Tragic $52,039 |
| Immigrants | Panama | 7.7 /100 | #218 | Tragic $51,962 |
| Immigrants | Ghana | 6.9 /100 | #219 | Tragic $51,836 |
| Immigrants | Armenia | 6.6 /100 | #220 | Tragic $51,793 |
Demographics Similar to Macedonians by Median Male Earnings
In terms of median male earnings, the demographic groups most similar to Macedonians are Immigrants from England ($59,527, a difference of 0.010%), Afghan ($59,554, a difference of 0.050%), Italian ($59,551, a difference of 0.050%), Immigrants from Argentina ($59,491, a difference of 0.050%), and Immigrants from Moldova ($59,417, a difference of 0.18%).
| Demographics | Rating | Rank | Median Male Earnings |
| Immigrants | Hungary | 99.5 /100 | #80 | Exceptional $59,806 |
| Ukrainians | 99.4 /100 | #81 | Exceptional $59,728 |
| Croatians | 99.4 /100 | #82 | Exceptional $59,715 |
| Immigrants | Italy | 99.4 /100 | #83 | Exceptional $59,691 |
| Afghans | 99.3 /100 | #84 | Exceptional $59,554 |
| Italians | 99.3 /100 | #85 | Exceptional $59,551 |
| Immigrants | England | 99.3 /100 | #86 | Exceptional $59,527 |
| Macedonians | 99.3 /100 | #87 | Exceptional $59,522 |
| Immigrants | Argentina | 99.3 /100 | #88 | Exceptional $59,491 |
| Immigrants | Moldova | 99.2 /100 | #89 | Exceptional $59,417 |
| Austrians | 99.2 /100 | #90 | Exceptional $59,359 |
| Laotians | 99.2 /100 | #91 | Exceptional $59,351 |
| Immigrants | Kazakhstan | 99.1 /100 | #92 | Exceptional $59,278 |
| Immigrants | Southern Europe | 99.0 /100 | #93 | Exceptional $59,217 |
| Immigrants | North Macedonia | 99.0 /100 | #94 | Exceptional $59,189 |