Armenian vs Guyanese Median Household Income
COMPARE
Armenian
Guyanese
Median Household Income
Median Household Income Comparison
Armenians
Guyanese
$91,807
MEDIAN HOUSEHOLD INCOME
98.7/ 100
METRIC RATING
95th/ 347
METRIC RANK
$80,734
MEDIAN HOUSEHOLD INCOME
5.7/ 100
METRIC RATING
227th/ 347
METRIC RANK
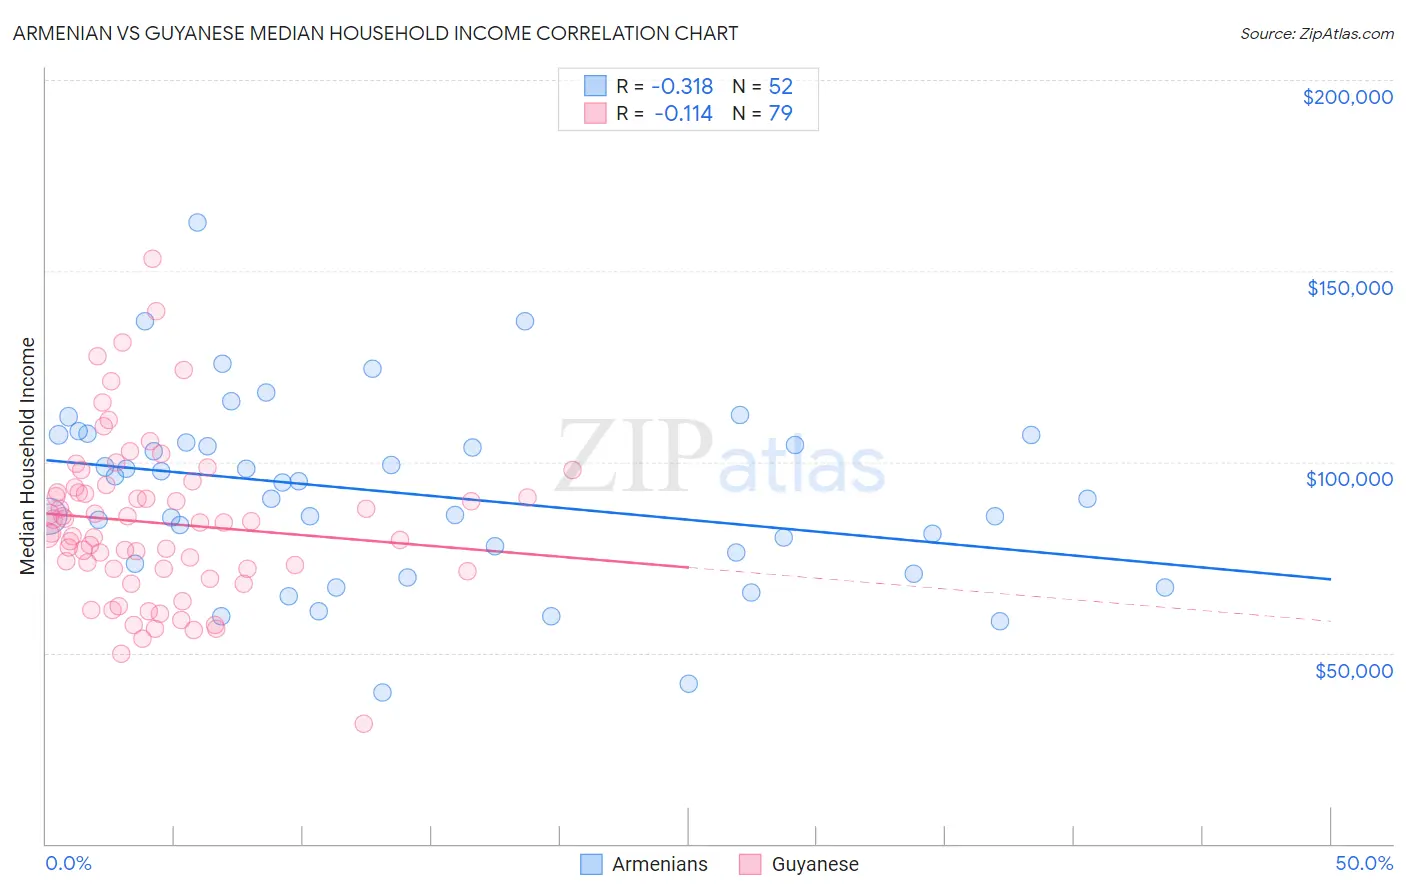
Armenian vs Guyanese Median Household Income Correlation Chart
The statistical analysis conducted on geographies consisting of 310,713,421 people shows a mild negative correlation between the proportion of Armenians and median household income in the United States with a correlation coefficient (R) of -0.318 and weighted average of $91,807. Similarly, the statistical analysis conducted on geographies consisting of 176,770,411 people shows a poor negative correlation between the proportion of Guyanese and median household income in the United States with a correlation coefficient (R) of -0.114 and weighted average of $80,734, a difference of 13.7%.
Median Household Income Correlation Summary
| Measurement | Armenian | Guyanese |
| Minimum | $39,713 | $31,571 |
| Maximum | $162,732 | $153,152 |
| Range | $123,019 | $121,581 |
| Mean | $91,613 | $83,976 |
| Median | $92,502 | $84,085 |
| Interquartile 25% (IQ1) | $74,815 | $71,864 |
| Interquartile 75% (IQ3) | $106,031 | $93,235 |
| Interquartile Range (IQR) | $31,215 | $21,371 |
| Standard Deviation (Sample) | $24,104 | $21,109 |
| Standard Deviation (Population) | $23,871 | $20,975 |
Similar Demographics by Median Household Income
Demographics Similar to Armenians by Median Household Income
In terms of median household income, the demographic groups most similar to Armenians are Jordanian ($91,794, a difference of 0.010%), Immigrants from North America ($91,860, a difference of 0.060%), Immigrants from Serbia ($91,730, a difference of 0.080%), Immigrants from Lebanon ($91,887, a difference of 0.090%), and Immigrants from Western Europe ($91,936, a difference of 0.14%).
| Demographics | Rating | Rank | Median Household Income |
| Immigrants | Canada | 98.8 /100 | #88 | Exceptional $92,029 |
| Romanians | 98.8 /100 | #89 | Exceptional $91,994 |
| Assyrians/Chaldeans/Syriacs | 98.8 /100 | #90 | Exceptional $91,991 |
| Immigrants | Vietnam | 98.8 /100 | #91 | Exceptional $91,987 |
| Immigrants | Western Europe | 98.8 /100 | #92 | Exceptional $91,936 |
| Immigrants | Lebanon | 98.7 /100 | #93 | Exceptional $91,887 |
| Immigrants | North America | 98.7 /100 | #94 | Exceptional $91,860 |
| Armenians | 98.7 /100 | #95 | Exceptional $91,807 |
| Jordanians | 98.7 /100 | #96 | Exceptional $91,794 |
| Immigrants | Serbia | 98.6 /100 | #97 | Exceptional $91,730 |
| Immigrants | Southern Europe | 98.5 /100 | #98 | Exceptional $91,605 |
| Immigrants | South Eastern Asia | 98.4 /100 | #99 | Exceptional $91,541 |
| Ukrainians | 98.3 /100 | #100 | Exceptional $91,456 |
| Immigrants | Moldova | 98.3 /100 | #101 | Exceptional $91,446 |
| Austrians | 98.2 /100 | #102 | Exceptional $91,339 |
Demographics Similar to Guyanese by Median Household Income
In terms of median household income, the demographic groups most similar to Guyanese are Immigrants from Bangladesh ($80,722, a difference of 0.010%), Immigrants from Panama ($80,873, a difference of 0.17%), Delaware ($80,527, a difference of 0.26%), Scotch-Irish ($80,972, a difference of 0.29%), and Malaysian ($81,064, a difference of 0.41%).
| Demographics | Rating | Rank | Median Household Income |
| Immigrants | Venezuela | 9.0 /100 | #220 | Tragic $81,506 |
| Immigrants | Ghana | 9.0 /100 | #221 | Tragic $81,489 |
| Immigrants | Nigeria | 7.7 /100 | #222 | Tragic $81,236 |
| Immigrants | El Salvador | 7.6 /100 | #223 | Tragic $81,213 |
| Malaysians | 7.0 /100 | #224 | Tragic $81,064 |
| Scotch-Irish | 6.6 /100 | #225 | Tragic $80,972 |
| Immigrants | Panama | 6.2 /100 | #226 | Tragic $80,873 |
| Guyanese | 5.7 /100 | #227 | Tragic $80,734 |
| Immigrants | Bangladesh | 5.7 /100 | #228 | Tragic $80,722 |
| Delaware | 5.0 /100 | #229 | Tragic $80,527 |
| Bermudans | 4.7 /100 | #230 | Tragic $80,406 |
| Trinidadians and Tobagonians | 4.7 /100 | #231 | Tragic $80,402 |
| Immigrants | Trinidad and Tobago | 4.6 /100 | #232 | Tragic $80,373 |
| Immigrants | Azores | 4.5 /100 | #233 | Tragic $80,357 |
| Immigrants | Ecuador | 4.5 /100 | #234 | Tragic $80,341 |