Tohono O'odham vs Guyanese Median Household Income
COMPARE
Tohono O'odham
Guyanese
Median Household Income
Median Household Income Comparison
Tohono O'odham
Guyanese
$61,663
MEDIAN HOUSEHOLD INCOME
0.0/ 100
METRIC RATING
344th/ 347
METRIC RANK
$80,734
MEDIAN HOUSEHOLD INCOME
5.7/ 100
METRIC RATING
227th/ 347
METRIC RANK
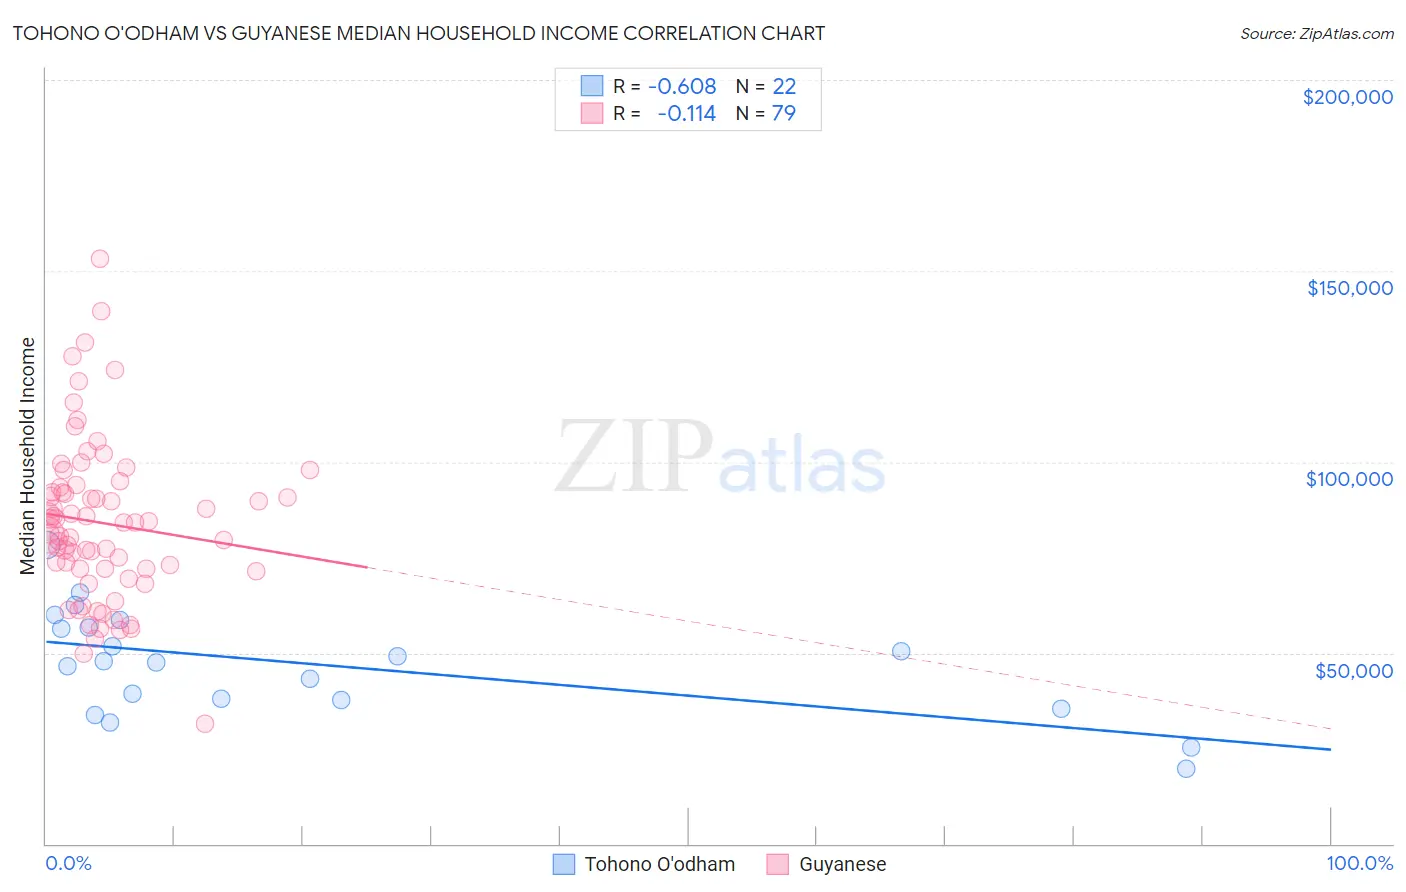
Tohono O'odham vs Guyanese Median Household Income Correlation Chart
The statistical analysis conducted on geographies consisting of 58,714,823 people shows a significant negative correlation between the proportion of Tohono O'odham and median household income in the United States with a correlation coefficient (R) of -0.608 and weighted average of $61,663. Similarly, the statistical analysis conducted on geographies consisting of 176,770,411 people shows a poor negative correlation between the proportion of Guyanese and median household income in the United States with a correlation coefficient (R) of -0.114 and weighted average of $80,734, a difference of 30.9%.
Median Household Income Correlation Summary
| Measurement | Tohono O'odham | Guyanese |
| Minimum | $19,643 | $31,571 |
| Maximum | $78,331 | $153,152 |
| Range | $58,688 | $121,581 |
| Mean | $47,012 | $83,976 |
| Median | $47,638 | $84,085 |
| Interquartile 25% (IQ1) | $37,566 | $71,864 |
| Interquartile 75% (IQ3) | $56,538 | $93,235 |
| Interquartile Range (IQR) | $18,972 | $21,371 |
| Standard Deviation (Sample) | $13,995 | $21,109 |
| Standard Deviation (Population) | $13,673 | $20,975 |
Similar Demographics by Median Household Income
Demographics Similar to Tohono O'odham by Median Household Income
In terms of median household income, the demographic groups most similar to Tohono O'odham are Houma ($62,575, a difference of 1.5%), Pima ($63,262, a difference of 2.6%), Crow ($63,681, a difference of 3.3%), Puerto Rican ($59,197, a difference of 4.2%), and Navajo ($59,159, a difference of 4.2%).
| Demographics | Rating | Rank | Median Household Income |
| Creek | 0.0 /100 | #333 | Tragic $67,715 |
| Blacks/African Americans | 0.0 /100 | #334 | Tragic $67,573 |
| Cheyenne | 0.0 /100 | #335 | Tragic $66,974 |
| Immigrants | Congo | 0.0 /100 | #336 | Tragic $66,768 |
| Kiowa | 0.0 /100 | #337 | Tragic $65,914 |
| Immigrants | Yemen | 0.0 /100 | #338 | Tragic $65,194 |
| Hopi | 0.0 /100 | #339 | Tragic $65,043 |
| Pueblo | 0.0 /100 | #340 | Tragic $64,692 |
| Crow | 0.0 /100 | #341 | Tragic $63,681 |
| Pima | 0.0 /100 | #342 | Tragic $63,262 |
| Houma | 0.0 /100 | #343 | Tragic $62,575 |
| Tohono O'odham | 0.0 /100 | #344 | Tragic $61,663 |
| Puerto Ricans | 0.0 /100 | #345 | Tragic $59,197 |
| Navajo | 0.0 /100 | #346 | Tragic $59,159 |
| Lumbee | 0.0 /100 | #347 | Tragic $54,644 |
Demographics Similar to Guyanese by Median Household Income
In terms of median household income, the demographic groups most similar to Guyanese are Immigrants from Bangladesh ($80,722, a difference of 0.010%), Immigrants from Panama ($80,873, a difference of 0.17%), Delaware ($80,527, a difference of 0.26%), Scotch-Irish ($80,972, a difference of 0.29%), and Malaysian ($81,064, a difference of 0.41%).
| Demographics | Rating | Rank | Median Household Income |
| Immigrants | Venezuela | 9.0 /100 | #220 | Tragic $81,506 |
| Immigrants | Ghana | 9.0 /100 | #221 | Tragic $81,489 |
| Immigrants | Nigeria | 7.7 /100 | #222 | Tragic $81,236 |
| Immigrants | El Salvador | 7.6 /100 | #223 | Tragic $81,213 |
| Malaysians | 7.0 /100 | #224 | Tragic $81,064 |
| Scotch-Irish | 6.6 /100 | #225 | Tragic $80,972 |
| Immigrants | Panama | 6.2 /100 | #226 | Tragic $80,873 |
| Guyanese | 5.7 /100 | #227 | Tragic $80,734 |
| Immigrants | Bangladesh | 5.7 /100 | #228 | Tragic $80,722 |
| Delaware | 5.0 /100 | #229 | Tragic $80,527 |
| Bermudans | 4.7 /100 | #230 | Tragic $80,406 |
| Trinidadians and Tobagonians | 4.7 /100 | #231 | Tragic $80,402 |
| Immigrants | Trinidad and Tobago | 4.6 /100 | #232 | Tragic $80,373 |
| Immigrants | Azores | 4.5 /100 | #233 | Tragic $80,357 |
| Immigrants | Ecuador | 4.5 /100 | #234 | Tragic $80,341 |