Chilean vs Macedonian Per Capita Income
COMPARE
Chilean
Macedonian
Per Capita Income
Per Capita Income Comparison
Chileans
Macedonians
$46,459
PER CAPITA INCOME
95.9/ 100
METRIC RATING
110th/ 347
METRIC RANK
$47,573
PER CAPITA INCOME
98.8/ 100
METRIC RATING
91st/ 347
METRIC RANK
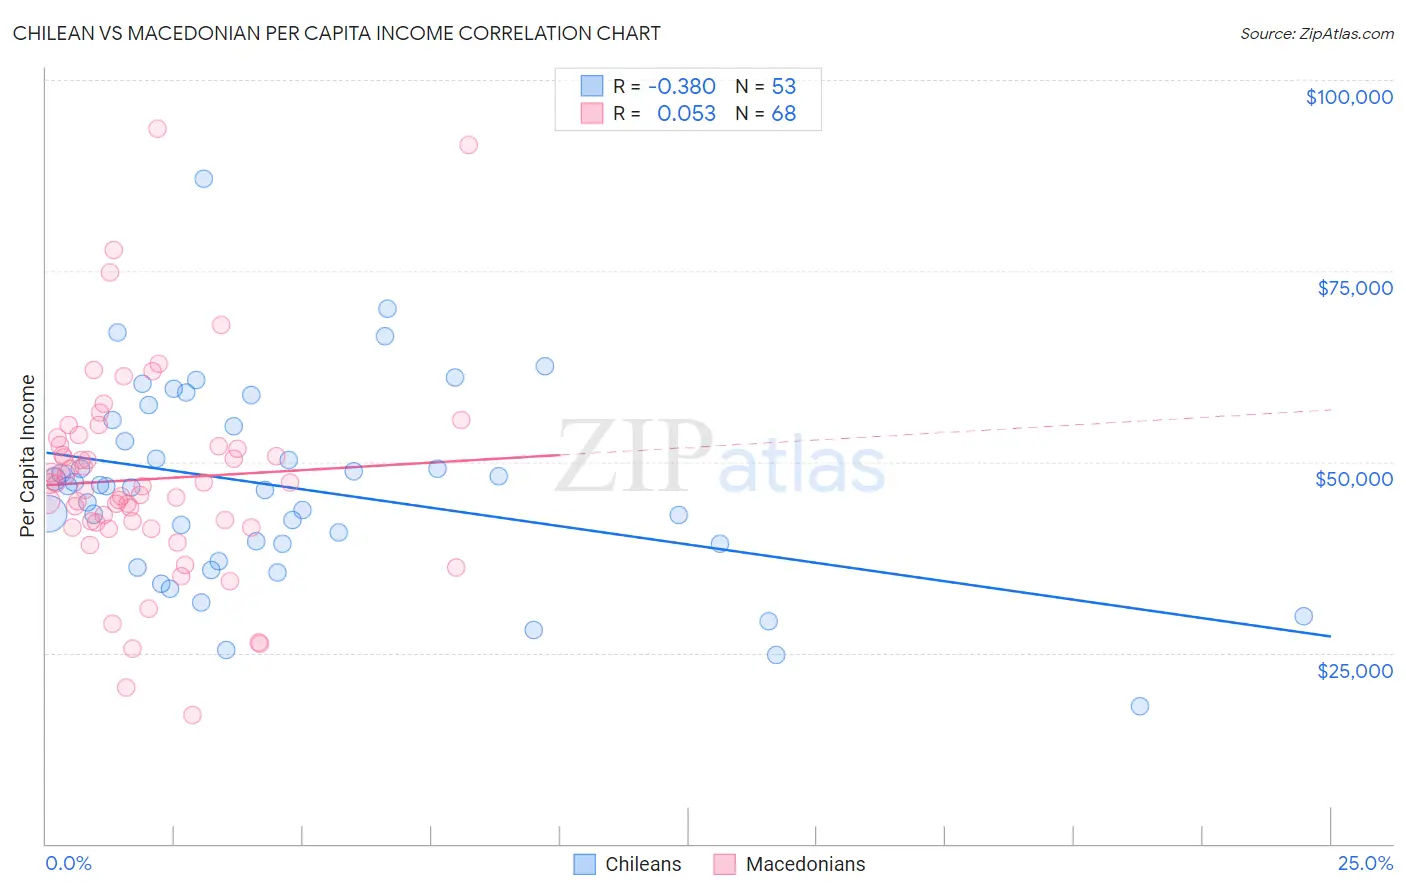
Chilean vs Macedonian Per Capita Income Correlation Chart
The statistical analysis conducted on geographies consisting of 256,682,930 people shows a mild negative correlation between the proportion of Chileans and per capita income in the United States with a correlation coefficient (R) of -0.380 and weighted average of $46,459. Similarly, the statistical analysis conducted on geographies consisting of 132,587,632 people shows a slight positive correlation between the proportion of Macedonians and per capita income in the United States with a correlation coefficient (R) of 0.053 and weighted average of $47,573, a difference of 2.4%.
Per Capita Income Correlation Summary
| Measurement | Chilean | Macedonian |
| Minimum | $18,080 | $16,916 |
| Maximum | $87,144 | $93,662 |
| Range | $69,064 | $76,746 |
| Mean | $46,506 | $47,728 |
| Median | $46,761 | $46,977 |
| Interquartile 25% (IQ1) | $38,083 | $41,808 |
| Interquartile 75% (IQ3) | $55,083 | $52,108 |
| Interquartile Range (IQR) | $17,000 | $10,300 |
| Standard Deviation (Sample) | $12,893 | $13,530 |
| Standard Deviation (Population) | $12,770 | $13,431 |
Demographics Similar to Chileans and Macedonians by Per Capita Income
In terms of per capita income, the demographic groups most similar to Chileans are Immigrants from Northern Africa ($46,531, a difference of 0.15%), Immigrants from Kuwait ($46,543, a difference of 0.18%), Serbian ($46,551, a difference of 0.20%), British ($46,571, a difference of 0.24%), and Ethiopian ($46,569, a difference of 0.24%). Similarly, the demographic groups most similar to Macedonians are Italian ($47,574, a difference of 0.0%), Immigrants from Moldova ($47,489, a difference of 0.18%), Immigrants from Zimbabwe ($47,394, a difference of 0.38%), Albanian ($47,379, a difference of 0.41%), and Immigrants from Egypt ($47,361, a difference of 0.45%).
| Demographics | Rating | Rank | Per Capita Income |
| Italians | 98.8 /100 | #90 | Exceptional $47,574 |
| Macedonians | 98.8 /100 | #91 | Exceptional $47,573 |
| Immigrants | Moldova | 98.7 /100 | #92 | Exceptional $47,489 |
| Immigrants | Zimbabwe | 98.5 /100 | #93 | Exceptional $47,394 |
| Albanians | 98.5 /100 | #94 | Exceptional $47,379 |
| Immigrants | Egypt | 98.5 /100 | #95 | Exceptional $47,361 |
| Alsatians | 98.3 /100 | #96 | Exceptional $47,284 |
| Carpatho Rusyns | 98.2 /100 | #97 | Exceptional $47,248 |
| Immigrants | Pakistan | 97.9 /100 | #98 | Exceptional $47,084 |
| Laotians | 97.8 /100 | #99 | Exceptional $47,041 |
| Immigrants | Lebanon | 97.5 /100 | #100 | Exceptional $46,938 |
| Immigrants | Uzbekistan | 97.5 /100 | #101 | Exceptional $46,929 |
| Immigrants | Western Asia | 97.4 /100 | #102 | Exceptional $46,876 |
| Syrians | 97.2 /100 | #103 | Exceptional $46,837 |
| Brazilians | 96.8 /100 | #104 | Exceptional $46,700 |
| British | 96.3 /100 | #105 | Exceptional $46,571 |
| Ethiopians | 96.3 /100 | #106 | Exceptional $46,569 |
| Serbians | 96.2 /100 | #107 | Exceptional $46,551 |
| Immigrants | Kuwait | 96.2 /100 | #108 | Exceptional $46,543 |
| Immigrants | Northern Africa | 96.2 /100 | #109 | Exceptional $46,531 |
| Chileans | 95.9 /100 | #110 | Exceptional $46,459 |