Immigrants from Singapore vs Macedonian Per Capita Income
COMPARE
Immigrants from Singapore
Macedonian
Per Capita Income
Per Capita Income Comparison
Immigrants from Singapore
Macedonians
$58,353
PER CAPITA INCOME
100.0/ 100
METRIC RATING
3rd/ 347
METRIC RANK
$47,573
PER CAPITA INCOME
98.8/ 100
METRIC RATING
91st/ 347
METRIC RANK
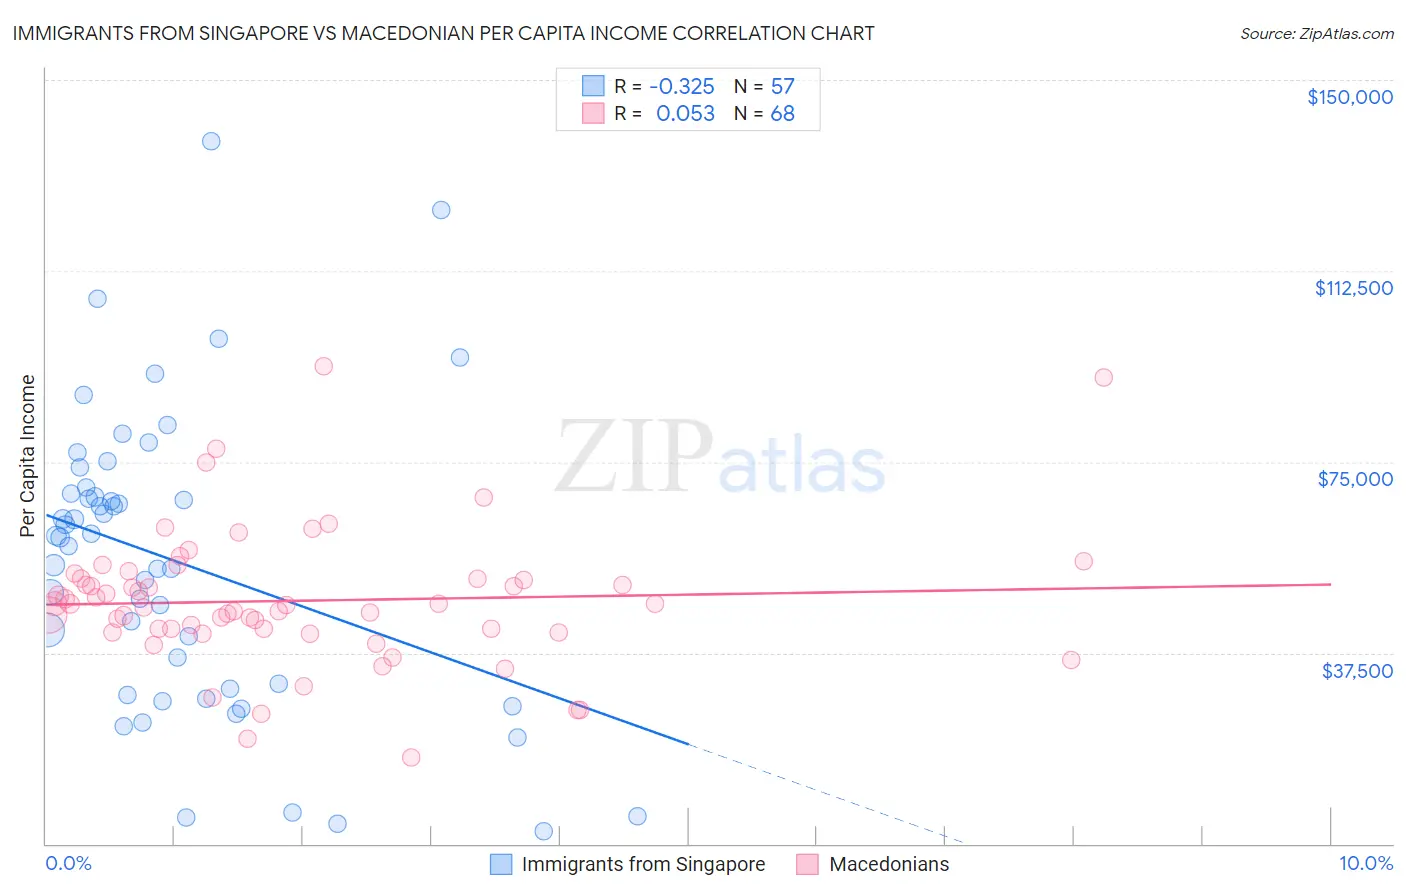
Immigrants from Singapore vs Macedonian Per Capita Income Correlation Chart
The statistical analysis conducted on geographies consisting of 137,503,143 people shows a mild negative correlation between the proportion of Immigrants from Singapore and per capita income in the United States with a correlation coefficient (R) of -0.325 and weighted average of $58,353. Similarly, the statistical analysis conducted on geographies consisting of 132,587,632 people shows a slight positive correlation between the proportion of Macedonians and per capita income in the United States with a correlation coefficient (R) of 0.053 and weighted average of $47,573, a difference of 22.7%.
Per Capita Income Correlation Summary
| Measurement | Immigrants from Singapore | Macedonian |
| Minimum | $2,563 | $16,916 |
| Maximum | $138,022 | $93,662 |
| Range | $135,459 | $76,746 |
| Mean | $55,363 | $47,728 |
| Median | $60,089 | $46,977 |
| Interquartile 25% (IQ1) | $29,825 | $41,808 |
| Interquartile 75% (IQ3) | $69,357 | $52,108 |
| Interquartile Range (IQR) | $39,532 | $10,300 |
| Standard Deviation (Sample) | $29,306 | $13,530 |
| Standard Deviation (Population) | $29,048 | $13,431 |
Similar Demographics by Per Capita Income
Demographics Similar to Immigrants from Singapore by Per Capita Income
In terms of per capita income, the demographic groups most similar to Immigrants from Singapore are Immigrants from Australia ($57,953, a difference of 0.69%), Iranian ($58,786, a difference of 0.74%), Immigrants from Iran ($57,759, a difference of 1.0%), Immigrants from Taiwan ($57,742, a difference of 1.1%), and Filipino ($59,066, a difference of 1.2%).
| Demographics | Rating | Rank | Per Capita Income |
| Filipinos | 100.0 /100 | #1 | Exceptional $59,066 |
| Iranians | 100.0 /100 | #2 | Exceptional $58,786 |
| Immigrants | Singapore | 100.0 /100 | #3 | Exceptional $58,353 |
| Immigrants | Australia | 100.0 /100 | #4 | Exceptional $57,953 |
| Immigrants | Iran | 100.0 /100 | #5 | Exceptional $57,759 |
| Immigrants | Taiwan | 100.0 /100 | #6 | Exceptional $57,742 |
| Immigrants | Israel | 100.0 /100 | #7 | Exceptional $57,384 |
| Immigrants | Hong Kong | 100.0 /100 | #8 | Exceptional $56,709 |
| Immigrants | Ireland | 100.0 /100 | #9 | Exceptional $56,584 |
| Okinawans | 100.0 /100 | #10 | Exceptional $55,817 |
| Eastern Europeans | 100.0 /100 | #11 | Exceptional $55,780 |
| Immigrants | Sweden | 100.0 /100 | #12 | Exceptional $55,582 |
| Immigrants | India | 100.0 /100 | #13 | Exceptional $55,268 |
| Immigrants | Belgium | 100.0 /100 | #14 | Exceptional $55,082 |
| Cypriots | 100.0 /100 | #15 | Exceptional $54,899 |
Demographics Similar to Macedonians by Per Capita Income
In terms of per capita income, the demographic groups most similar to Macedonians are Italian ($47,574, a difference of 0.0%), Immigrants from Moldova ($47,489, a difference of 0.18%), Northern European ($47,698, a difference of 0.26%), Croatian ($47,742, a difference of 0.36%), and Immigrants from Zimbabwe ($47,394, a difference of 0.38%).
| Demographics | Rating | Rank | Per Capita Income |
| Immigrants | Ukraine | 99.3 /100 | #84 | Exceptional $48,134 |
| Austrians | 99.3 /100 | #85 | Exceptional $48,116 |
| Immigrants | Southern Europe | 99.3 /100 | #86 | Exceptional $48,027 |
| Ukrainians | 99.3 /100 | #87 | Exceptional $48,014 |
| Croatians | 99.0 /100 | #88 | Exceptional $47,742 |
| Northern Europeans | 98.9 /100 | #89 | Exceptional $47,698 |
| Italians | 98.8 /100 | #90 | Exceptional $47,574 |
| Macedonians | 98.8 /100 | #91 | Exceptional $47,573 |
| Immigrants | Moldova | 98.7 /100 | #92 | Exceptional $47,489 |
| Immigrants | Zimbabwe | 98.5 /100 | #93 | Exceptional $47,394 |
| Albanians | 98.5 /100 | #94 | Exceptional $47,379 |
| Immigrants | Egypt | 98.5 /100 | #95 | Exceptional $47,361 |
| Alsatians | 98.3 /100 | #96 | Exceptional $47,284 |
| Carpatho Rusyns | 98.2 /100 | #97 | Exceptional $47,248 |
| Immigrants | Pakistan | 97.9 /100 | #98 | Exceptional $47,084 |