Chilean vs Macedonian Disability Age 35 to 64
COMPARE
Chilean
Macedonian
Disability Age 35 to 64
Disability Age 35 to 64 Comparison
Chileans
Macedonians
10.2%
DISABILITY AGE 35 TO 64
99.0/ 100
METRIC RATING
88th/ 347
METRIC RANK
10.4%
DISABILITY AGE 35 TO 64
97.8/ 100
METRIC RATING
105th/ 347
METRIC RANK
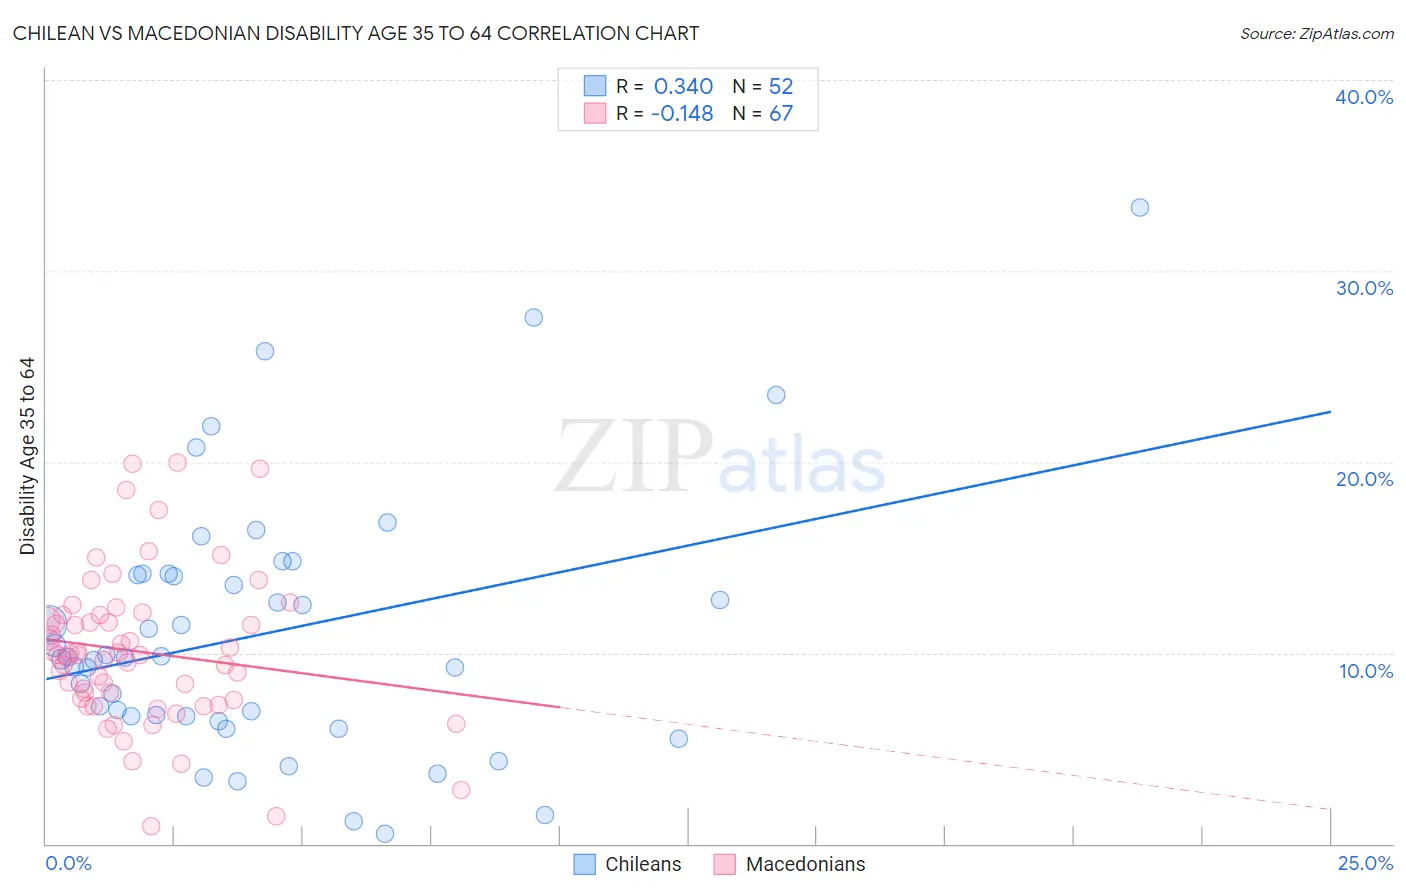
Chilean vs Macedonian Disability Age 35 to 64 Correlation Chart
The statistical analysis conducted on geographies consisting of 256,534,411 people shows a mild positive correlation between the proportion of Chileans and percentage of population with a disability between the ages 34 and 64 in the United States with a correlation coefficient (R) of 0.340 and weighted average of 10.2%. Similarly, the statistical analysis conducted on geographies consisting of 132,601,587 people shows a poor negative correlation between the proportion of Macedonians and percentage of population with a disability between the ages 34 and 64 in the United States with a correlation coefficient (R) of -0.148 and weighted average of 10.4%, a difference of 1.7%.
Disability Age 35 to 64 Correlation Summary
| Measurement | Chilean | Macedonian |
| Minimum | 0.50% | 0.93% |
| Maximum | 33.3% | 19.9% |
| Range | 32.8% | 19.0% |
| Mean | 11.0% | 10.1% |
| Median | 9.8% | 9.9% |
| Interquartile 25% (IQ1) | 6.7% | 7.5% |
| Interquartile 75% (IQ3) | 14.1% | 12.0% |
| Interquartile Range (IQR) | 7.4% | 4.4% |
| Standard Deviation (Sample) | 6.8% | 4.0% |
| Standard Deviation (Population) | 6.7% | 3.9% |
Demographics Similar to Chileans and Macedonians by Disability Age 35 to 64
In terms of disability age 35 to 64, the demographic groups most similar to Chileans are Uruguayan (10.2%, a difference of 0.010%), Afghan (10.3%, a difference of 0.12%), Immigrants from Lebanon (10.3%, a difference of 0.14%), Nicaraguan (10.2%, a difference of 0.23%), and Immigrants from Europe (10.2%, a difference of 0.24%). Similarly, the demographic groups most similar to Macedonians are Immigrants from Austria (10.4%, a difference of 0.020%), Immigrants from Hungary (10.4%, a difference of 0.15%), Immigrants from Ukraine (10.4%, a difference of 0.16%), Immigrants from Western Asia (10.4%, a difference of 0.19%), and Immigrants from Philippines (10.4%, a difference of 0.26%).
| Demographics | Rating | Rank | Disability Age 35 to 64 |
| Immigrants | Europe | 99.1 /100 | #86 | Exceptional 10.2% |
| Nicaraguans | 99.1 /100 | #87 | Exceptional 10.2% |
| Chileans | 99.0 /100 | #88 | Exceptional 10.2% |
| Uruguayans | 99.0 /100 | #89 | Exceptional 10.2% |
| Afghans | 98.9 /100 | #90 | Exceptional 10.3% |
| Immigrants | Lebanon | 98.9 /100 | #91 | Exceptional 10.3% |
| Immigrants | Northern Africa | 98.7 /100 | #92 | Exceptional 10.3% |
| Immigrants | North Macedonia | 98.7 /100 | #93 | Exceptional 10.3% |
| Immigrants | Italy | 98.7 /100 | #94 | Exceptional 10.3% |
| Chinese | 98.7 /100 | #95 | Exceptional 10.3% |
| Immigrants | South Africa | 98.5 /100 | #96 | Exceptional 10.3% |
| Immigrants | Denmark | 98.4 /100 | #97 | Exceptional 10.3% |
| Immigrants | Uruguay | 98.3 /100 | #98 | Exceptional 10.3% |
| Palestinians | 98.2 /100 | #99 | Exceptional 10.4% |
| Immigrants | Jordan | 98.1 /100 | #100 | Exceptional 10.4% |
| Immigrants | Philippines | 98.0 /100 | #101 | Exceptional 10.4% |
| Immigrants | Western Asia | 98.0 /100 | #102 | Exceptional 10.4% |
| Immigrants | Ukraine | 97.9 /100 | #103 | Exceptional 10.4% |
| Immigrants | Austria | 97.8 /100 | #104 | Exceptional 10.4% |
| Macedonians | 97.8 /100 | #105 | Exceptional 10.4% |
| Immigrants | Hungary | 97.6 /100 | #106 | Exceptional 10.4% |