Chilean vs Belizean Per Capita Income
COMPARE
Chilean
Belizean
Per Capita Income
Per Capita Income Comparison
Chileans
Belizeans
$46,459
PER CAPITA INCOME
95.9/ 100
METRIC RATING
110th/ 347
METRIC RANK
$39,097
PER CAPITA INCOME
0.6/ 100
METRIC RATING
263rd/ 347
METRIC RANK
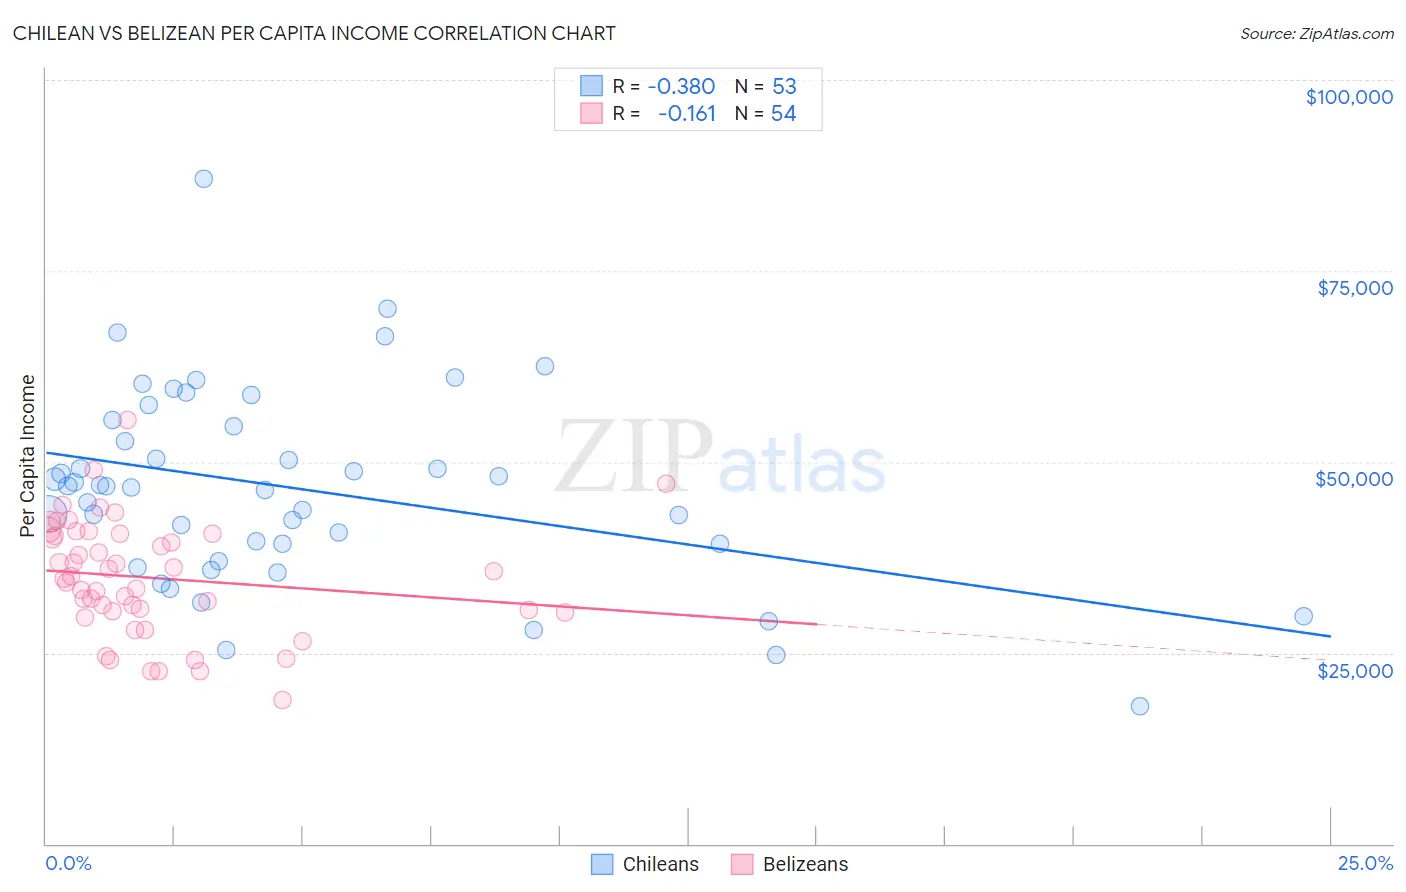
Chilean vs Belizean Per Capita Income Correlation Chart
The statistical analysis conducted on geographies consisting of 256,682,930 people shows a mild negative correlation between the proportion of Chileans and per capita income in the United States with a correlation coefficient (R) of -0.380 and weighted average of $46,459. Similarly, the statistical analysis conducted on geographies consisting of 144,225,006 people shows a poor negative correlation between the proportion of Belizeans and per capita income in the United States with a correlation coefficient (R) of -0.161 and weighted average of $39,097, a difference of 18.8%.
Per Capita Income Correlation Summary
| Measurement | Chilean | Belizean |
| Minimum | $18,080 | $18,752 |
| Maximum | $87,144 | $55,551 |
| Range | $69,064 | $36,799 |
| Mean | $46,506 | $34,798 |
| Median | $46,761 | $34,873 |
| Interquartile 25% (IQ1) | $38,083 | $30,514 |
| Interquartile 75% (IQ3) | $55,083 | $40,555 |
| Interquartile Range (IQR) | $17,000 | $10,041 |
| Standard Deviation (Sample) | $12,893 | $7,514 |
| Standard Deviation (Population) | $12,770 | $7,444 |
Similar Demographics by Per Capita Income
Demographics Similar to Chileans by Per Capita Income
In terms of per capita income, the demographic groups most similar to Chileans are Taiwanese ($46,455, a difference of 0.010%), Immigrants from Morocco ($46,430, a difference of 0.060%), Immigrants from Northern Africa ($46,531, a difference of 0.15%), Immigrants from Albania ($46,387, a difference of 0.15%), and Immigrants from Kuwait ($46,543, a difference of 0.18%).
| Demographics | Rating | Rank | Per Capita Income |
| Syrians | 97.2 /100 | #103 | Exceptional $46,837 |
| Brazilians | 96.8 /100 | #104 | Exceptional $46,700 |
| British | 96.3 /100 | #105 | Exceptional $46,571 |
| Ethiopians | 96.3 /100 | #106 | Exceptional $46,569 |
| Serbians | 96.2 /100 | #107 | Exceptional $46,551 |
| Immigrants | Kuwait | 96.2 /100 | #108 | Exceptional $46,543 |
| Immigrants | Northern Africa | 96.2 /100 | #109 | Exceptional $46,531 |
| Chileans | 95.9 /100 | #110 | Exceptional $46,459 |
| Taiwanese | 95.8 /100 | #111 | Exceptional $46,455 |
| Immigrants | Morocco | 95.7 /100 | #112 | Exceptional $46,430 |
| Immigrants | Albania | 95.5 /100 | #113 | Exceptional $46,387 |
| Afghans | 94.9 /100 | #114 | Exceptional $46,268 |
| Immigrants | Chile | 94.6 /100 | #115 | Exceptional $46,213 |
| Poles | 94.1 /100 | #116 | Exceptional $46,123 |
| Chinese | 93.9 /100 | #117 | Exceptional $46,098 |
Demographics Similar to Belizeans by Per Capita Income
In terms of per capita income, the demographic groups most similar to Belizeans are Iroquois ($39,104, a difference of 0.020%), Marshallese ($39,108, a difference of 0.030%), American ($39,039, a difference of 0.15%), Alaskan Athabascan ($39,163, a difference of 0.17%), and Spanish American ($39,012, a difference of 0.22%).
| Demographics | Rating | Rank | Per Capita Income |
| Hawaiians | 0.8 /100 | #256 | Tragic $39,403 |
| Nicaraguans | 0.8 /100 | #257 | Tragic $39,372 |
| Jamaicans | 0.7 /100 | #258 | Tragic $39,231 |
| Malaysians | 0.7 /100 | #259 | Tragic $39,194 |
| Alaskan Athabascans | 0.6 /100 | #260 | Tragic $39,163 |
| Marshallese | 0.6 /100 | #261 | Tragic $39,108 |
| Iroquois | 0.6 /100 | #262 | Tragic $39,104 |
| Belizeans | 0.6 /100 | #263 | Tragic $39,097 |
| Americans | 0.6 /100 | #264 | Tragic $39,039 |
| Spanish Americans | 0.5 /100 | #265 | Tragic $39,012 |
| Salvadorans | 0.5 /100 | #266 | Tragic $38,858 |
| Immigrants | Zaire | 0.4 /100 | #267 | Tragic $38,848 |
| Liberians | 0.4 /100 | #268 | Tragic $38,780 |
| Immigrants | Jamaica | 0.4 /100 | #269 | Tragic $38,766 |
| Immigrants | Belize | 0.3 /100 | #270 | Tragic $38,614 |