Chilean vs Immigrants from Cabo Verde Per Capita Income
COMPARE
Chilean
Immigrants from Cabo Verde
Per Capita Income
Per Capita Income Comparison
Chileans
Immigrants from Cabo Verde
$46,459
PER CAPITA INCOME
95.9/ 100
METRIC RATING
110th/ 347
METRIC RANK
$38,540
PER CAPITA INCOME
0.3/ 100
METRIC RATING
272nd/ 347
METRIC RANK
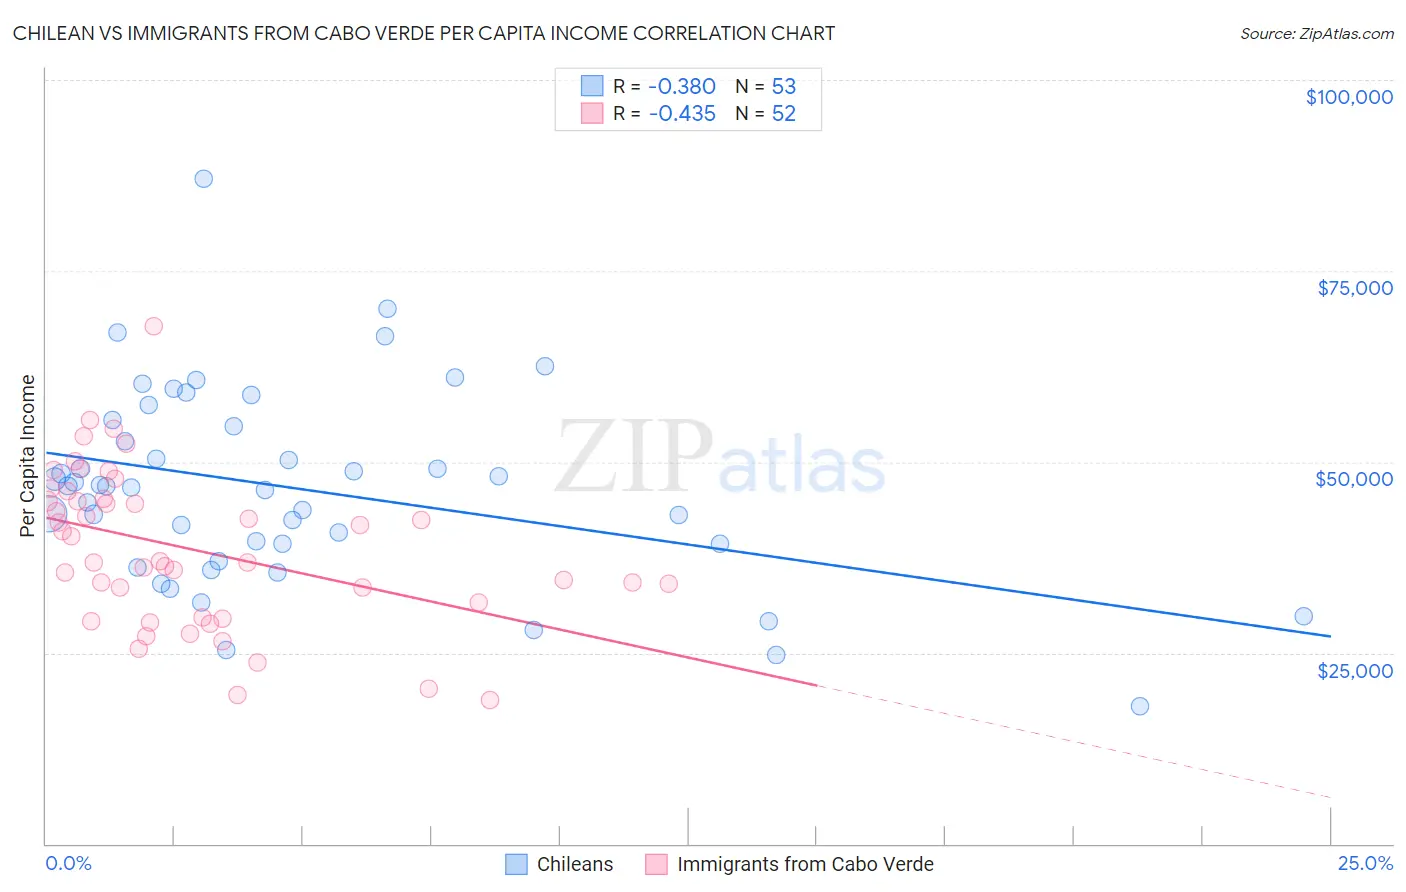
Chilean vs Immigrants from Cabo Verde Per Capita Income Correlation Chart
The statistical analysis conducted on geographies consisting of 256,682,930 people shows a mild negative correlation between the proportion of Chileans and per capita income in the United States with a correlation coefficient (R) of -0.380 and weighted average of $46,459. Similarly, the statistical analysis conducted on geographies consisting of 38,153,224 people shows a moderate negative correlation between the proportion of Immigrants from Cabo Verde and per capita income in the United States with a correlation coefficient (R) of -0.435 and weighted average of $38,540, a difference of 20.5%.
Per Capita Income Correlation Summary
| Measurement | Chilean | Immigrants from Cabo Verde |
| Minimum | $18,080 | $18,870 |
| Maximum | $87,144 | $67,818 |
| Range | $69,064 | $48,948 |
| Mean | $46,506 | $38,585 |
| Median | $46,761 | $36,913 |
| Interquartile 25% (IQ1) | $38,083 | $30,580 |
| Interquartile 75% (IQ3) | $55,083 | $45,064 |
| Interquartile Range (IQR) | $17,000 | $14,484 |
| Standard Deviation (Sample) | $12,893 | $10,185 |
| Standard Deviation (Population) | $12,770 | $10,087 |
Similar Demographics by Per Capita Income
Demographics Similar to Chileans by Per Capita Income
In terms of per capita income, the demographic groups most similar to Chileans are Taiwanese ($46,455, a difference of 0.010%), Immigrants from Morocco ($46,430, a difference of 0.060%), Immigrants from Northern Africa ($46,531, a difference of 0.15%), Immigrants from Albania ($46,387, a difference of 0.15%), and Immigrants from Kuwait ($46,543, a difference of 0.18%).
| Demographics | Rating | Rank | Per Capita Income |
| Syrians | 97.2 /100 | #103 | Exceptional $46,837 |
| Brazilians | 96.8 /100 | #104 | Exceptional $46,700 |
| British | 96.3 /100 | #105 | Exceptional $46,571 |
| Ethiopians | 96.3 /100 | #106 | Exceptional $46,569 |
| Serbians | 96.2 /100 | #107 | Exceptional $46,551 |
| Immigrants | Kuwait | 96.2 /100 | #108 | Exceptional $46,543 |
| Immigrants | Northern Africa | 96.2 /100 | #109 | Exceptional $46,531 |
| Chileans | 95.9 /100 | #110 | Exceptional $46,459 |
| Taiwanese | 95.8 /100 | #111 | Exceptional $46,455 |
| Immigrants | Morocco | 95.7 /100 | #112 | Exceptional $46,430 |
| Immigrants | Albania | 95.5 /100 | #113 | Exceptional $46,387 |
| Afghans | 94.9 /100 | #114 | Exceptional $46,268 |
| Immigrants | Chile | 94.6 /100 | #115 | Exceptional $46,213 |
| Poles | 94.1 /100 | #116 | Exceptional $46,123 |
| Chinese | 93.9 /100 | #117 | Exceptional $46,098 |
Demographics Similar to Immigrants from Cabo Verde by Per Capita Income
In terms of per capita income, the demographic groups most similar to Immigrants from Cabo Verde are Central American ($38,560, a difference of 0.050%), Immigrants from Belize ($38,614, a difference of 0.19%), Nepalese ($38,442, a difference of 0.25%), Immigrants from El Salvador ($38,394, a difference of 0.38%), and Immigrants from Jamaica ($38,766, a difference of 0.59%).
| Demographics | Rating | Rank | Per Capita Income |
| Spanish Americans | 0.5 /100 | #265 | Tragic $39,012 |
| Salvadorans | 0.5 /100 | #266 | Tragic $38,858 |
| Immigrants | Zaire | 0.4 /100 | #267 | Tragic $38,848 |
| Liberians | 0.4 /100 | #268 | Tragic $38,780 |
| Immigrants | Jamaica | 0.4 /100 | #269 | Tragic $38,766 |
| Immigrants | Belize | 0.3 /100 | #270 | Tragic $38,614 |
| Central Americans | 0.3 /100 | #271 | Tragic $38,560 |
| Immigrants | Cabo Verde | 0.3 /100 | #272 | Tragic $38,540 |
| Nepalese | 0.3 /100 | #273 | Tragic $38,442 |
| Immigrants | El Salvador | 0.3 /100 | #274 | Tragic $38,394 |
| Immigrants | Liberia | 0.2 /100 | #275 | Tragic $38,165 |
| Hmong | 0.2 /100 | #276 | Tragic $38,120 |
| Comanche | 0.2 /100 | #277 | Tragic $38,088 |
| Immigrants | Nicaragua | 0.2 /100 | #278 | Tragic $38,065 |
| Colville | 0.2 /100 | #279 | Tragic $38,047 |