Cheyenne vs Immigrants from Philippines Median Family Income
COMPARE
Cheyenne
Immigrants from Philippines
Median Family Income
Median Family Income Comparison
Cheyenne
Immigrants from Philippines
$81,385
MEDIAN FAMILY INCOME
0.0/ 100
METRIC RATING
330th/ 347
METRIC RANK
$108,288
MEDIAN FAMILY INCOME
94.6/ 100
METRIC RATING
117th/ 347
METRIC RANK
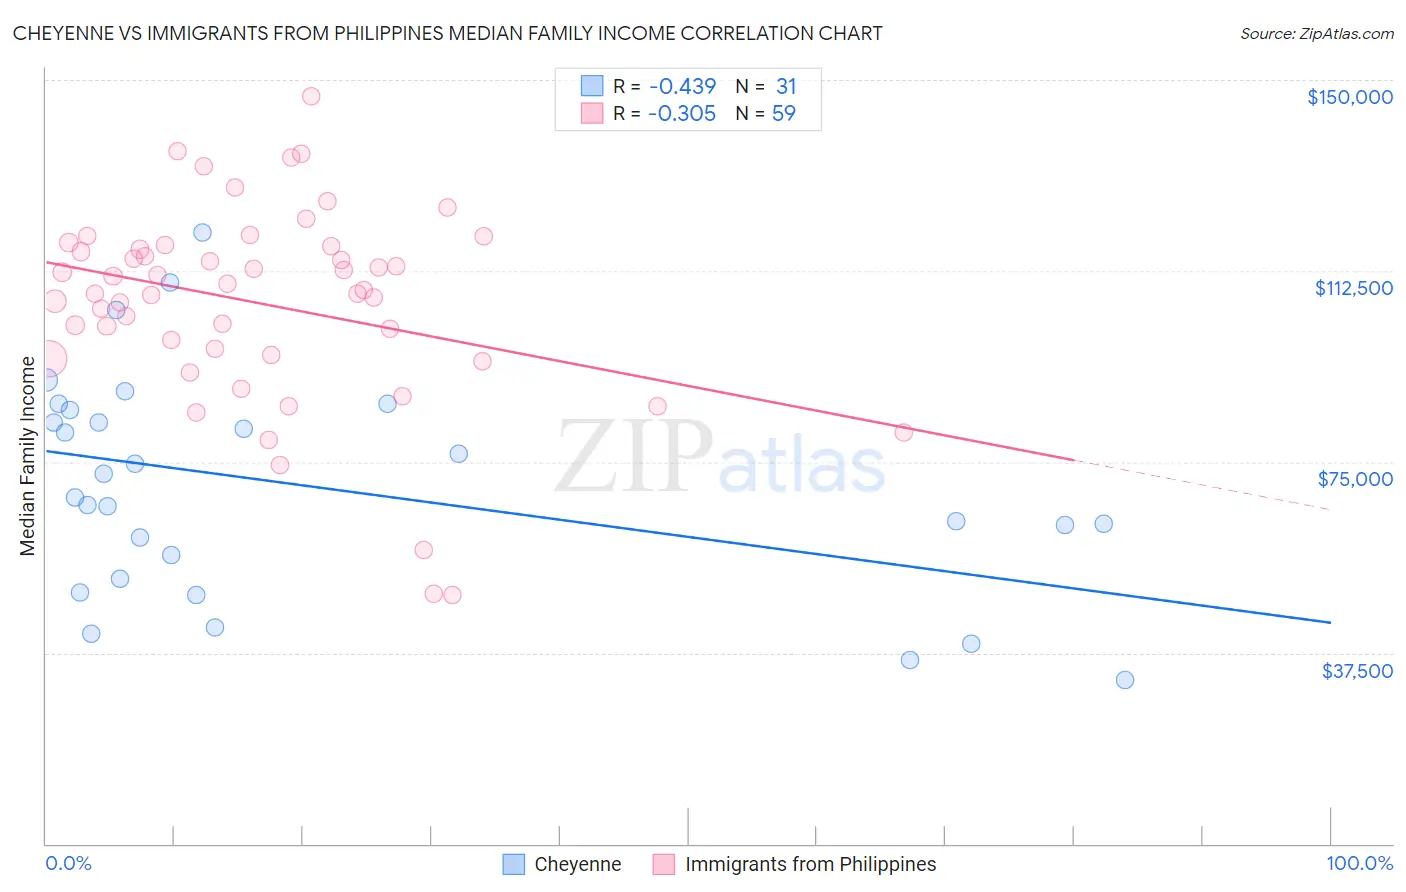
Cheyenne vs Immigrants from Philippines Median Family Income Correlation Chart
The statistical analysis conducted on geographies consisting of 80,698,521 people shows a moderate negative correlation between the proportion of Cheyenne and median family income in the United States with a correlation coefficient (R) of -0.439 and weighted average of $81,385. Similarly, the statistical analysis conducted on geographies consisting of 470,858,648 people shows a mild negative correlation between the proportion of Immigrants from Philippines and median family income in the United States with a correlation coefficient (R) of -0.305 and weighted average of $108,288, a difference of 33.1%.
Median Family Income Correlation Summary
| Measurement | Cheyenne | Immigrants from Philippines |
| Minimum | $32,159 | $48,750 |
| Maximum | $120,128 | $146,906 |
| Range | $87,969 | $98,156 |
| Mean | $70,077 | $106,076 |
| Median | $67,927 | $108,731 |
| Interquartile 25% (IQ1) | $52,031 | $96,071 |
| Interquartile 75% (IQ3) | $85,161 | $117,321 |
| Interquartile Range (IQR) | $33,130 | $21,250 |
| Standard Deviation (Sample) | $21,843 | $19,555 |
| Standard Deviation (Population) | $21,488 | $19,389 |
Similar Demographics by Median Family Income
Demographics Similar to Cheyenne by Median Family Income
In terms of median family income, the demographic groups most similar to Cheyenne are Immigrants from Dominican Republic ($81,233, a difference of 0.19%), Dutch West Indian ($81,852, a difference of 0.57%), Native/Alaskan ($80,908, a difference of 0.59%), Kiowa ($80,885, a difference of 0.62%), and Black/African American ($81,912, a difference of 0.65%).
| Demographics | Rating | Rank | Median Family Income |
| Bahamians | 0.0 /100 | #323 | Tragic $82,631 |
| Creek | 0.0 /100 | #324 | Tragic $82,560 |
| Sioux | 0.0 /100 | #325 | Tragic $82,386 |
| Immigrants | Congo | 0.0 /100 | #326 | Tragic $82,216 |
| Arapaho | 0.0 /100 | #327 | Tragic $82,064 |
| Blacks/African Americans | 0.0 /100 | #328 | Tragic $81,912 |
| Dutch West Indians | 0.0 /100 | #329 | Tragic $81,852 |
| Cheyenne | 0.0 /100 | #330 | Tragic $81,385 |
| Immigrants | Dominican Republic | 0.0 /100 | #331 | Tragic $81,233 |
| Natives/Alaskans | 0.0 /100 | #332 | Tragic $80,908 |
| Kiowa | 0.0 /100 | #333 | Tragic $80,885 |
| Menominee | 0.0 /100 | #334 | Tragic $79,563 |
| Yup'ik | 0.0 /100 | #335 | Tragic $79,290 |
| Immigrants | Cuba | 0.0 /100 | #336 | Tragic $78,249 |
| Yuman | 0.0 /100 | #337 | Tragic $78,055 |
Demographics Similar to Immigrants from Philippines by Median Family Income
In terms of median family income, the demographic groups most similar to Immigrants from Philippines are Ethiopian ($108,251, a difference of 0.030%), Sri Lankan ($108,234, a difference of 0.050%), Immigrants from Northern Africa ($108,161, a difference of 0.12%), Chilean ($108,429, a difference of 0.13%), and European ($108,099, a difference of 0.18%).
| Demographics | Rating | Rank | Median Family Income |
| British | 95.6 /100 | #110 | Exceptional $108,705 |
| Immigrants | Western Asia | 95.6 /100 | #111 | Exceptional $108,691 |
| Immigrants | Poland | 95.3 /100 | #112 | Exceptional $108,570 |
| Immigrants | Saudi Arabia | 95.2 /100 | #113 | Exceptional $108,544 |
| Poles | 95.2 /100 | #114 | Exceptional $108,507 |
| Swedes | 95.1 /100 | #115 | Exceptional $108,499 |
| Chileans | 95.0 /100 | #116 | Exceptional $108,429 |
| Immigrants | Philippines | 94.6 /100 | #117 | Exceptional $108,288 |
| Ethiopians | 94.5 /100 | #118 | Exceptional $108,251 |
| Sri Lankans | 94.5 /100 | #119 | Exceptional $108,234 |
| Immigrants | Northern Africa | 94.3 /100 | #120 | Exceptional $108,161 |
| Europeans | 94.1 /100 | #121 | Exceptional $108,099 |
| Immigrants | Jordan | 92.9 /100 | #122 | Exceptional $107,715 |
| Carpatho Rusyns | 92.2 /100 | #123 | Exceptional $107,502 |
| Pakistanis | 91.7 /100 | #124 | Exceptional $107,390 |