Cheyenne vs Lumbee Vision Disability
COMPARE
Cheyenne
Lumbee
Vision Disability
Vision Disability Comparison
Cheyenne
Lumbee
3.1%
VISION DISABILITY
0.0/ 100
METRIC RATING
334th/ 347
METRIC RANK
3.4%
VISION DISABILITY
0.0/ 100
METRIC RATING
345th/ 347
METRIC RANK
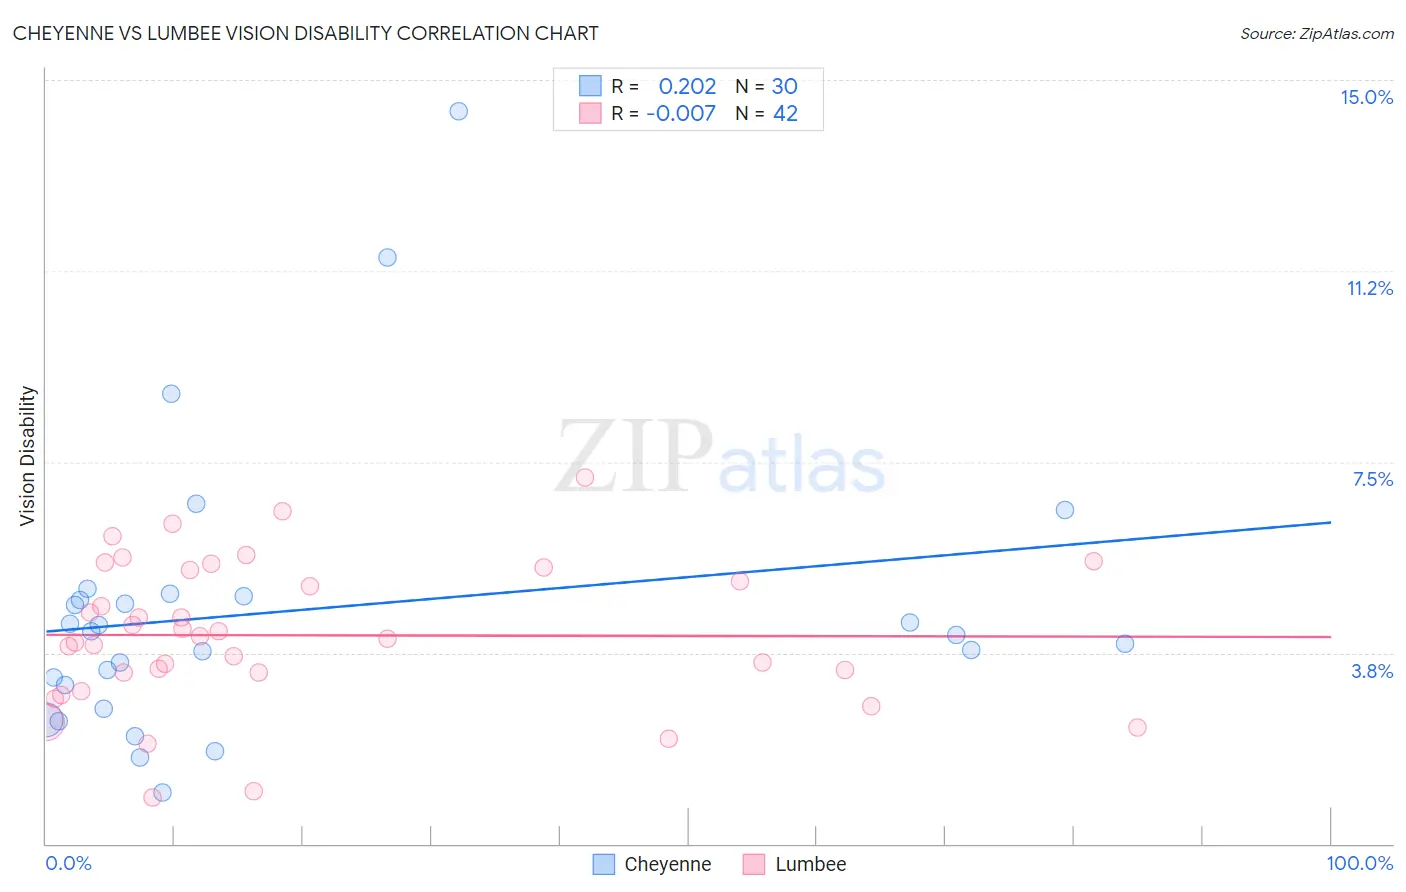
Cheyenne vs Lumbee Vision Disability Correlation Chart
The statistical analysis conducted on geographies consisting of 80,705,474 people shows a weak positive correlation between the proportion of Cheyenne and percentage of population with vision disability in the United States with a correlation coefficient (R) of 0.202 and weighted average of 3.1%. Similarly, the statistical analysis conducted on geographies consisting of 92,245,889 people shows no correlation between the proportion of Lumbee and percentage of population with vision disability in the United States with a correlation coefficient (R) of -0.007 and weighted average of 3.4%, a difference of 9.4%.
Vision Disability Correlation Summary
| Measurement | Cheyenne | Lumbee |
| Minimum | 1.0% | 0.90% |
| Maximum | 14.4% | 7.2% |
| Range | 13.4% | 6.3% |
| Mean | 4.6% | 4.1% |
| Median | 4.1% | 4.1% |
| Interquartile 25% (IQ1) | 3.1% | 3.4% |
| Interquartile 75% (IQ3) | 4.9% | 5.4% |
| Interquartile Range (IQR) | 1.7% | 2.0% |
| Standard Deviation (Sample) | 2.8% | 1.4% |
| Standard Deviation (Population) | 2.8% | 1.4% |
Demographics Similar to Cheyenne and Lumbee by Vision Disability
In terms of vision disability, the demographic groups most similar to Cheyenne are Cajun (3.1%, a difference of 1.1%), Seminole (3.1%, a difference of 1.1%), Central American Indian (3.0%, a difference of 1.5%), Navajo (3.1%, a difference of 1.7%), and Alaskan Athabascan (3.1%, a difference of 1.8%). Similarly, the demographic groups most similar to Lumbee are Pueblo (3.3%, a difference of 1.6%), Pima (3.3%, a difference of 1.6%), Houma (3.4%, a difference of 1.7%), Choctaw (3.3%, a difference of 2.7%), and Kiowa (3.3%, a difference of 4.1%).
| Demographics | Rating | Rank | Vision Disability |
| Yuman | 0.0 /100 | #328 | Tragic 3.0% |
| Apache | 0.0 /100 | #329 | Tragic 3.0% |
| Colville | 0.0 /100 | #330 | Tragic 3.0% |
| Central American Indians | 0.0 /100 | #331 | Tragic 3.0% |
| Seminole | 0.0 /100 | #332 | Tragic 3.1% |
| Cajuns | 0.0 /100 | #333 | Tragic 3.1% |
| Cheyenne | 0.0 /100 | #334 | Tragic 3.1% |
| Navajo | 0.0 /100 | #335 | Tragic 3.1% |
| Alaskan Athabascans | 0.0 /100 | #336 | Tragic 3.1% |
| Dutch West Indians | 0.0 /100 | #337 | Tragic 3.2% |
| Chickasaw | 0.0 /100 | #338 | Tragic 3.2% |
| Tsimshian | 0.0 /100 | #339 | Tragic 3.2% |
| Creek | 0.0 /100 | #340 | Tragic 3.2% |
| Kiowa | 0.0 /100 | #341 | Tragic 3.3% |
| Choctaw | 0.0 /100 | #342 | Tragic 3.3% |
| Pima | 0.0 /100 | #343 | Tragic 3.3% |
| Pueblo | 0.0 /100 | #344 | Tragic 3.3% |
| Lumbee | 0.0 /100 | #345 | Tragic 3.4% |
| Houma | 0.0 /100 | #346 | Tragic 3.4% |
| Puerto Ricans | 0.0 /100 | #347 | Tragic 3.9% |