Cheyenne vs Immigrants from Korea Median Family Income
COMPARE
Cheyenne
Immigrants from Korea
Median Family Income
Median Family Income Comparison
Cheyenne
Immigrants from Korea
$81,385
MEDIAN FAMILY INCOME
0.0/ 100
METRIC RATING
330th/ 347
METRIC RANK
$122,800
MEDIAN FAMILY INCOME
100.0/ 100
METRIC RATING
21st/ 347
METRIC RANK
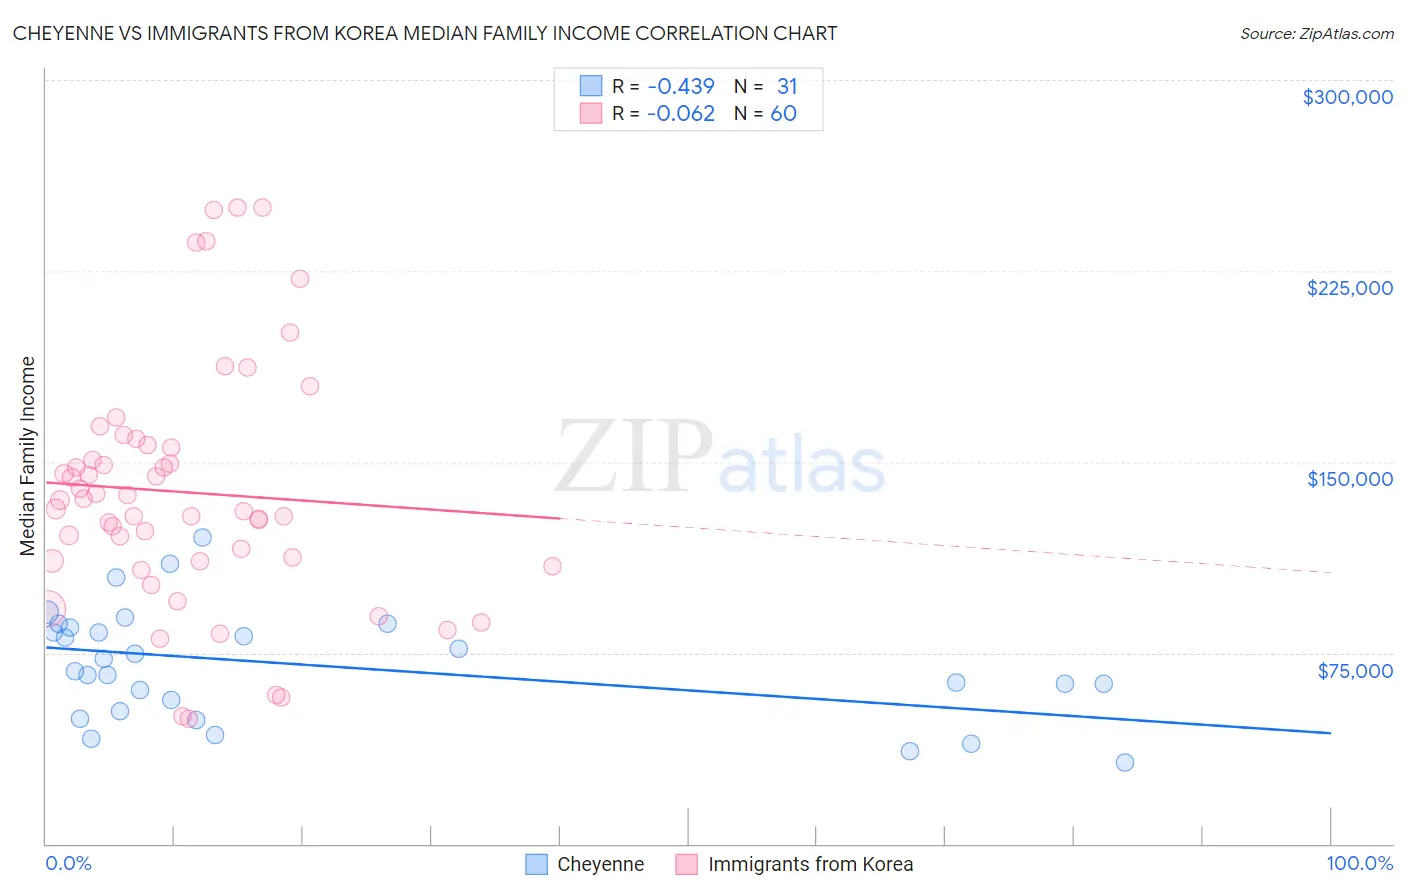
Cheyenne vs Immigrants from Korea Median Family Income Correlation Chart
The statistical analysis conducted on geographies consisting of 80,698,521 people shows a moderate negative correlation between the proportion of Cheyenne and median family income in the United States with a correlation coefficient (R) of -0.439 and weighted average of $81,385. Similarly, the statistical analysis conducted on geographies consisting of 415,814,318 people shows a slight negative correlation between the proportion of Immigrants from Korea and median family income in the United States with a correlation coefficient (R) of -0.062 and weighted average of $122,800, a difference of 50.9%.
Median Family Income Correlation Summary
| Measurement | Cheyenne | Immigrants from Korea |
| Minimum | $32,159 | $49,182 |
| Maximum | $120,128 | $250,001 |
| Range | $87,969 | $200,819 |
| Mean | $70,077 | $138,061 |
| Median | $67,927 | $133,220 |
| Interquartile 25% (IQ1) | $52,031 | $110,996 |
| Interquartile 75% (IQ3) | $85,161 | $156,101 |
| Interquartile Range (IQR) | $33,130 | $45,105 |
| Standard Deviation (Sample) | $21,843 | $47,393 |
| Standard Deviation (Population) | $21,488 | $46,996 |
Similar Demographics by Median Family Income
Demographics Similar to Cheyenne by Median Family Income
In terms of median family income, the demographic groups most similar to Cheyenne are Immigrants from Dominican Republic ($81,233, a difference of 0.19%), Dutch West Indian ($81,852, a difference of 0.57%), Native/Alaskan ($80,908, a difference of 0.59%), Kiowa ($80,885, a difference of 0.62%), and Black/African American ($81,912, a difference of 0.65%).
| Demographics | Rating | Rank | Median Family Income |
| Bahamians | 0.0 /100 | #323 | Tragic $82,631 |
| Creek | 0.0 /100 | #324 | Tragic $82,560 |
| Sioux | 0.0 /100 | #325 | Tragic $82,386 |
| Immigrants | Congo | 0.0 /100 | #326 | Tragic $82,216 |
| Arapaho | 0.0 /100 | #327 | Tragic $82,064 |
| Blacks/African Americans | 0.0 /100 | #328 | Tragic $81,912 |
| Dutch West Indians | 0.0 /100 | #329 | Tragic $81,852 |
| Cheyenne | 0.0 /100 | #330 | Tragic $81,385 |
| Immigrants | Dominican Republic | 0.0 /100 | #331 | Tragic $81,233 |
| Natives/Alaskans | 0.0 /100 | #332 | Tragic $80,908 |
| Kiowa | 0.0 /100 | #333 | Tragic $80,885 |
| Menominee | 0.0 /100 | #334 | Tragic $79,563 |
| Yup'ik | 0.0 /100 | #335 | Tragic $79,290 |
| Immigrants | Cuba | 0.0 /100 | #336 | Tragic $78,249 |
| Yuman | 0.0 /100 | #337 | Tragic $78,055 |
Demographics Similar to Immigrants from Korea by Median Family Income
In terms of median family income, the demographic groups most similar to Immigrants from Korea are Immigrants from Sweden ($122,765, a difference of 0.030%), Immigrants from Japan ($122,764, a difference of 0.030%), Burmese ($123,369, a difference of 0.46%), Immigrants from Northern Europe ($121,840, a difference of 0.79%), and Immigrants from Belgium ($123,831, a difference of 0.84%).
| Demographics | Rating | Rank | Median Family Income |
| Immigrants | South Central Asia | 100.0 /100 | #14 | Exceptional $125,956 |
| Eastern Europeans | 100.0 /100 | #15 | Exceptional $125,546 |
| Immigrants | China | 100.0 /100 | #16 | Exceptional $125,540 |
| Indians (Asian) | 100.0 /100 | #17 | Exceptional $125,312 |
| Immigrants | Eastern Asia | 100.0 /100 | #18 | Exceptional $125,150 |
| Immigrants | Belgium | 100.0 /100 | #19 | Exceptional $123,831 |
| Burmese | 100.0 /100 | #20 | Exceptional $123,369 |
| Immigrants | Korea | 100.0 /100 | #21 | Exceptional $122,800 |
| Immigrants | Sweden | 100.0 /100 | #22 | Exceptional $122,765 |
| Immigrants | Japan | 100.0 /100 | #23 | Exceptional $122,764 |
| Immigrants | Northern Europe | 100.0 /100 | #24 | Exceptional $121,840 |
| Turks | 100.0 /100 | #25 | Exceptional $121,202 |
| Immigrants | Switzerland | 100.0 /100 | #26 | Exceptional $120,726 |
| Russians | 100.0 /100 | #27 | Exceptional $120,487 |
| Immigrants | Denmark | 100.0 /100 | #28 | Exceptional $120,445 |