Thai vs Immigrants from Korea Median Family Income
COMPARE
Thai
Immigrants from Korea
Median Family Income
Median Family Income Comparison
Thais
Immigrants from Korea
$131,281
MEDIAN FAMILY INCOME
100.0/ 100
METRIC RATING
6th/ 347
METRIC RANK
$122,800
MEDIAN FAMILY INCOME
100.0/ 100
METRIC RATING
21st/ 347
METRIC RANK
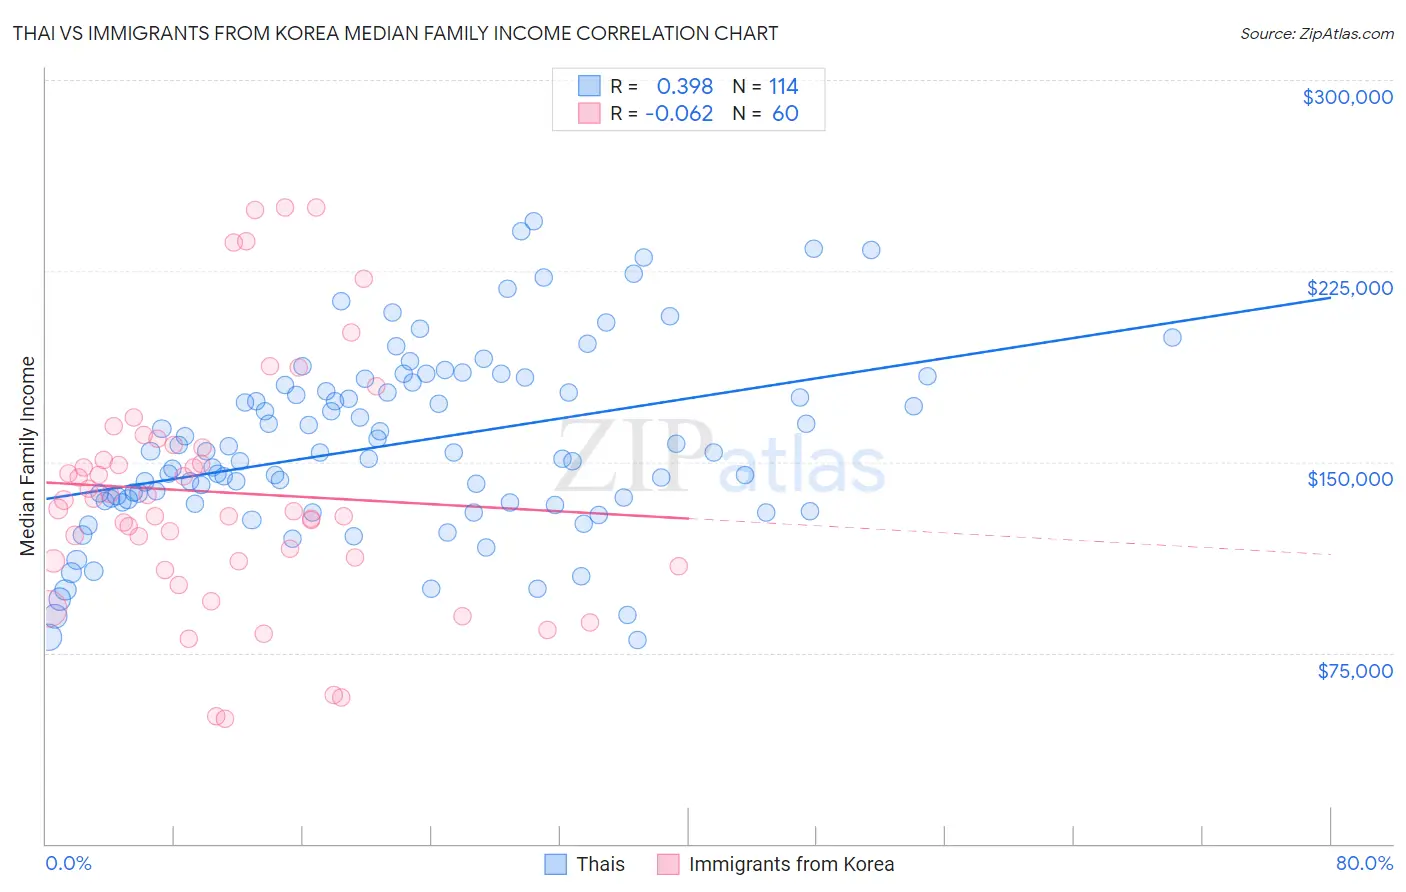
Thai vs Immigrants from Korea Median Family Income Correlation Chart
The statistical analysis conducted on geographies consisting of 475,139,998 people shows a mild positive correlation between the proportion of Thais and median family income in the United States with a correlation coefficient (R) of 0.398 and weighted average of $131,281. Similarly, the statistical analysis conducted on geographies consisting of 415,814,318 people shows a slight negative correlation between the proportion of Immigrants from Korea and median family income in the United States with a correlation coefficient (R) of -0.062 and weighted average of $122,800, a difference of 6.9%.
Median Family Income Correlation Summary
| Measurement | Thai | Immigrants from Korea |
| Minimum | $80,156 | $49,182 |
| Maximum | $244,604 | $250,001 |
| Range | $164,448 | $200,819 |
| Mean | $156,697 | $138,061 |
| Median | $153,787 | $133,220 |
| Interquartile 25% (IQ1) | $134,216 | $110,996 |
| Interquartile 75% (IQ3) | $179,995 | $156,101 |
| Interquartile Range (IQR) | $45,779 | $45,105 |
| Standard Deviation (Sample) | $35,454 | $47,393 |
| Standard Deviation (Population) | $35,298 | $46,996 |
Demographics Similar to Thais and Immigrants from Korea by Median Family Income
In terms of median family income, the demographic groups most similar to Thais are Immigrants from Hong Kong ($131,067, a difference of 0.16%), Immigrants from Iran ($130,894, a difference of 0.30%), Okinawan ($129,979, a difference of 1.0%), Iranian ($133,839, a difference of 1.9%), and Immigrants from India ($134,028, a difference of 2.1%). Similarly, the demographic groups most similar to Immigrants from Korea are Immigrants from Sweden ($122,765, a difference of 0.030%), Immigrants from Japan ($122,764, a difference of 0.030%), Burmese ($123,369, a difference of 0.46%), Immigrants from Belgium ($123,831, a difference of 0.84%), and Immigrants from Eastern Asia ($125,150, a difference of 1.9%).
| Demographics | Rating | Rank | Median Family Income |
| Immigrants | Singapore | 100.0 /100 | #3 | Exceptional $134,818 |
| Immigrants | India | 100.0 /100 | #4 | Exceptional $134,028 |
| Iranians | 100.0 /100 | #5 | Exceptional $133,839 |
| Thais | 100.0 /100 | #6 | Exceptional $131,281 |
| Immigrants | Hong Kong | 100.0 /100 | #7 | Exceptional $131,067 |
| Immigrants | Iran | 100.0 /100 | #8 | Exceptional $130,894 |
| Okinawans | 100.0 /100 | #9 | Exceptional $129,979 |
| Immigrants | Ireland | 100.0 /100 | #10 | Exceptional $127,584 |
| Immigrants | Israel | 100.0 /100 | #11 | Exceptional $127,430 |
| Cypriots | 100.0 /100 | #12 | Exceptional $127,064 |
| Immigrants | Australia | 100.0 /100 | #13 | Exceptional $126,620 |
| Immigrants | South Central Asia | 100.0 /100 | #14 | Exceptional $125,956 |
| Eastern Europeans | 100.0 /100 | #15 | Exceptional $125,546 |
| Immigrants | China | 100.0 /100 | #16 | Exceptional $125,540 |
| Indians (Asian) | 100.0 /100 | #17 | Exceptional $125,312 |
| Immigrants | Eastern Asia | 100.0 /100 | #18 | Exceptional $125,150 |
| Immigrants | Belgium | 100.0 /100 | #19 | Exceptional $123,831 |
| Burmese | 100.0 /100 | #20 | Exceptional $123,369 |
| Immigrants | Korea | 100.0 /100 | #21 | Exceptional $122,800 |
| Immigrants | Sweden | 100.0 /100 | #22 | Exceptional $122,765 |
| Immigrants | Japan | 100.0 /100 | #23 | Exceptional $122,764 |