Polish vs Immigrants from Korea Median Family Income
COMPARE
Polish
Immigrants from Korea
Median Family Income
Median Family Income Comparison
Poles
Immigrants from Korea
$108,507
MEDIAN FAMILY INCOME
95.2/ 100
METRIC RATING
114th/ 347
METRIC RANK
$122,800
MEDIAN FAMILY INCOME
100.0/ 100
METRIC RATING
21st/ 347
METRIC RANK
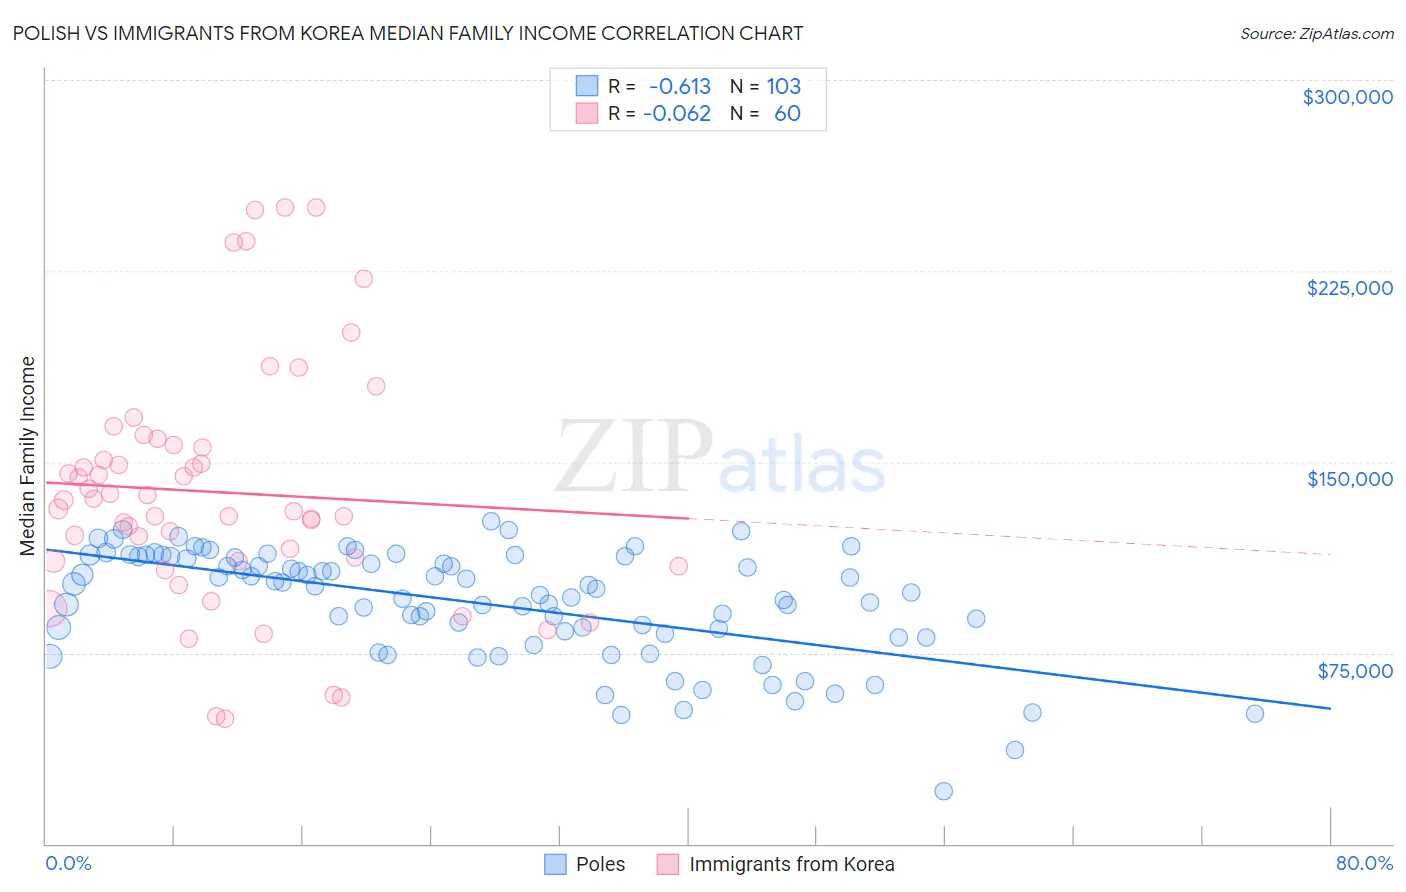
Polish vs Immigrants from Korea Median Family Income Correlation Chart
The statistical analysis conducted on geographies consisting of 559,354,572 people shows a significant negative correlation between the proportion of Poles and median family income in the United States with a correlation coefficient (R) of -0.613 and weighted average of $108,507. Similarly, the statistical analysis conducted on geographies consisting of 415,814,318 people shows a slight negative correlation between the proportion of Immigrants from Korea and median family income in the United States with a correlation coefficient (R) of -0.062 and weighted average of $122,800, a difference of 13.2%.
Median Family Income Correlation Summary
| Measurement | Polish | Immigrants from Korea |
| Minimum | $20,484 | $49,182 |
| Maximum | $126,779 | $250,001 |
| Range | $106,295 | $200,819 |
| Mean | $94,533 | $138,061 |
| Median | $100,344 | $133,220 |
| Interquartile 25% (IQ1) | $82,684 | $110,996 |
| Interquartile 75% (IQ3) | $112,830 | $156,101 |
| Interquartile Range (IQR) | $30,146 | $45,105 |
| Standard Deviation (Sample) | $21,570 | $47,393 |
| Standard Deviation (Population) | $21,465 | $46,996 |
Similar Demographics by Median Family Income
Demographics Similar to Poles by Median Family Income
In terms of median family income, the demographic groups most similar to Poles are Swedish ($108,499, a difference of 0.010%), Immigrants from Saudi Arabia ($108,544, a difference of 0.030%), Immigrants from Poland ($108,570, a difference of 0.060%), Chilean ($108,429, a difference of 0.070%), and Immigrants from Western Asia ($108,691, a difference of 0.17%).
| Demographics | Rating | Rank | Median Family Income |
| Immigrants | North Macedonia | 96.4 /100 | #107 | Exceptional $109,136 |
| Immigrants | Zimbabwe | 95.9 /100 | #108 | Exceptional $108,830 |
| Immigrants | Afghanistan | 95.6 /100 | #109 | Exceptional $108,709 |
| British | 95.6 /100 | #110 | Exceptional $108,705 |
| Immigrants | Western Asia | 95.6 /100 | #111 | Exceptional $108,691 |
| Immigrants | Poland | 95.3 /100 | #112 | Exceptional $108,570 |
| Immigrants | Saudi Arabia | 95.2 /100 | #113 | Exceptional $108,544 |
| Poles | 95.2 /100 | #114 | Exceptional $108,507 |
| Swedes | 95.1 /100 | #115 | Exceptional $108,499 |
| Chileans | 95.0 /100 | #116 | Exceptional $108,429 |
| Immigrants | Philippines | 94.6 /100 | #117 | Exceptional $108,288 |
| Ethiopians | 94.5 /100 | #118 | Exceptional $108,251 |
| Sri Lankans | 94.5 /100 | #119 | Exceptional $108,234 |
| Immigrants | Northern Africa | 94.3 /100 | #120 | Exceptional $108,161 |
| Europeans | 94.1 /100 | #121 | Exceptional $108,099 |
Demographics Similar to Immigrants from Korea by Median Family Income
In terms of median family income, the demographic groups most similar to Immigrants from Korea are Immigrants from Sweden ($122,765, a difference of 0.030%), Immigrants from Japan ($122,764, a difference of 0.030%), Burmese ($123,369, a difference of 0.46%), Immigrants from Northern Europe ($121,840, a difference of 0.79%), and Immigrants from Belgium ($123,831, a difference of 0.84%).
| Demographics | Rating | Rank | Median Family Income |
| Immigrants | South Central Asia | 100.0 /100 | #14 | Exceptional $125,956 |
| Eastern Europeans | 100.0 /100 | #15 | Exceptional $125,546 |
| Immigrants | China | 100.0 /100 | #16 | Exceptional $125,540 |
| Indians (Asian) | 100.0 /100 | #17 | Exceptional $125,312 |
| Immigrants | Eastern Asia | 100.0 /100 | #18 | Exceptional $125,150 |
| Immigrants | Belgium | 100.0 /100 | #19 | Exceptional $123,831 |
| Burmese | 100.0 /100 | #20 | Exceptional $123,369 |
| Immigrants | Korea | 100.0 /100 | #21 | Exceptional $122,800 |
| Immigrants | Sweden | 100.0 /100 | #22 | Exceptional $122,765 |
| Immigrants | Japan | 100.0 /100 | #23 | Exceptional $122,764 |
| Immigrants | Northern Europe | 100.0 /100 | #24 | Exceptional $121,840 |
| Turks | 100.0 /100 | #25 | Exceptional $121,202 |
| Immigrants | Switzerland | 100.0 /100 | #26 | Exceptional $120,726 |
| Russians | 100.0 /100 | #27 | Exceptional $120,487 |
| Immigrants | Denmark | 100.0 /100 | #28 | Exceptional $120,445 |