Immigrants from Lebanon vs Immigrants from Korea Median Family Income
COMPARE
Immigrants from Lebanon
Immigrants from Korea
Median Family Income
Median Family Income Comparison
Immigrants from Lebanon
Immigrants from Korea
$110,159
MEDIAN FAMILY INCOME
97.9/ 100
METRIC RATING
92nd/ 347
METRIC RANK
$122,800
MEDIAN FAMILY INCOME
100.0/ 100
METRIC RATING
21st/ 347
METRIC RANK
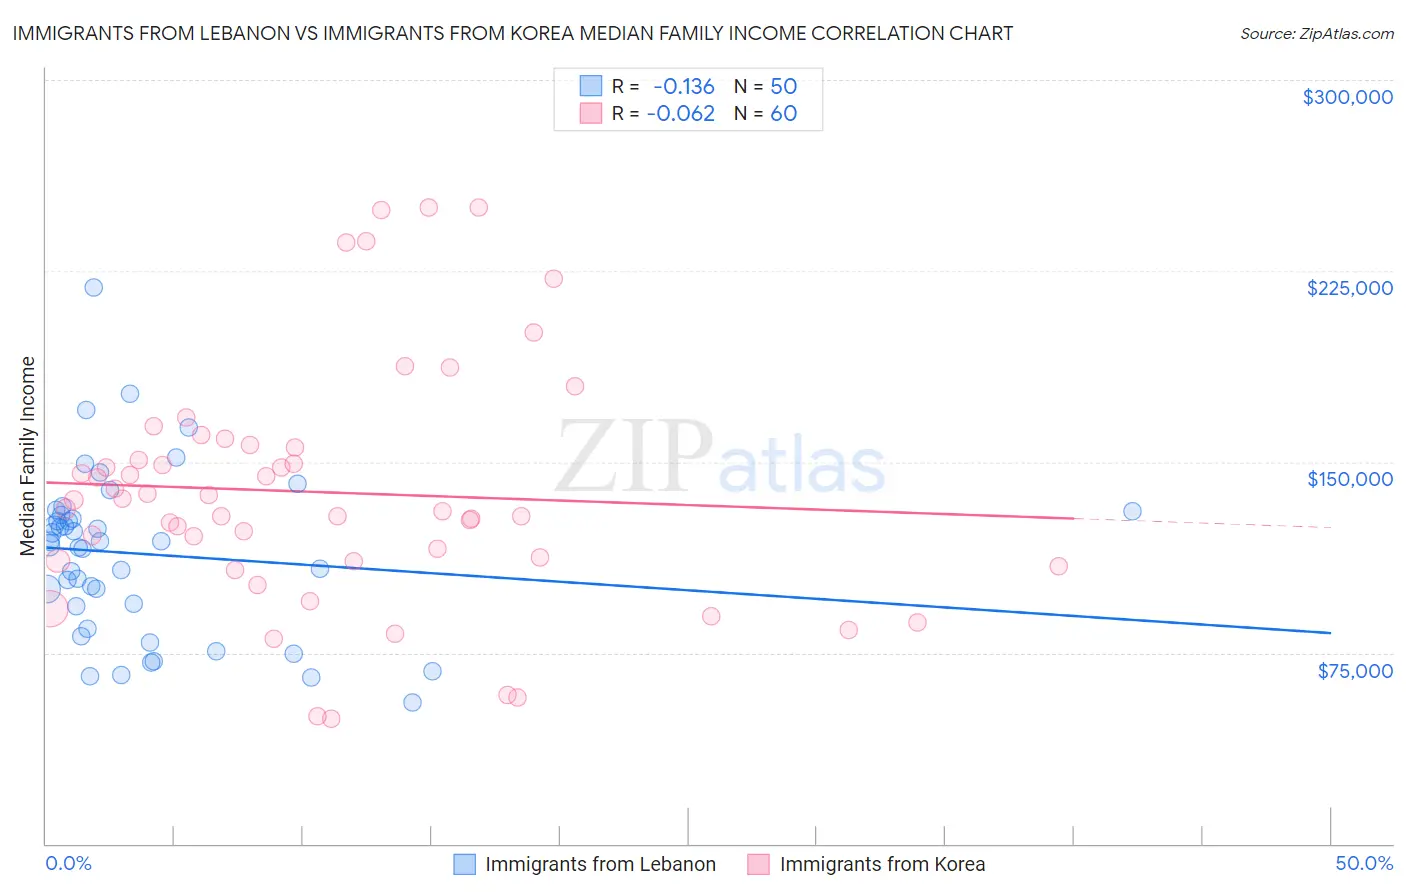
Immigrants from Lebanon vs Immigrants from Korea Median Family Income Correlation Chart
The statistical analysis conducted on geographies consisting of 217,094,496 people shows a poor negative correlation between the proportion of Immigrants from Lebanon and median family income in the United States with a correlation coefficient (R) of -0.136 and weighted average of $110,159. Similarly, the statistical analysis conducted on geographies consisting of 415,814,318 people shows a slight negative correlation between the proportion of Immigrants from Korea and median family income in the United States with a correlation coefficient (R) of -0.062 and weighted average of $122,800, a difference of 11.5%.
Median Family Income Correlation Summary
| Measurement | Immigrants from Lebanon | Immigrants from Korea |
| Minimum | $55,430 | $49,182 |
| Maximum | $218,700 | $250,001 |
| Range | $163,270 | $200,819 |
| Mean | $113,756 | $138,061 |
| Median | $117,906 | $133,220 |
| Interquartile 25% (IQ1) | $93,082 | $110,996 |
| Interquartile 75% (IQ3) | $129,106 | $156,101 |
| Interquartile Range (IQR) | $36,025 | $45,105 |
| Standard Deviation (Sample) | $32,559 | $47,393 |
| Standard Deviation (Population) | $32,232 | $46,996 |
Similar Demographics by Median Family Income
Demographics Similar to Immigrants from Lebanon by Median Family Income
In terms of median family income, the demographic groups most similar to Immigrants from Lebanon are Immigrants from Kazakhstan ($110,137, a difference of 0.020%), Korean ($110,103, a difference of 0.050%), Zimbabwean ($110,011, a difference of 0.13%), Immigrants from Moldova ($109,975, a difference of 0.17%), and Jordanian ($109,865, a difference of 0.27%).
| Demographics | Rating | Rank | Median Family Income |
| Croatians | 98.8 /100 | #85 | Exceptional $111,370 |
| Ukrainians | 98.8 /100 | #86 | Exceptional $111,368 |
| Austrians | 98.8 /100 | #87 | Exceptional $111,306 |
| Romanians | 98.8 /100 | #88 | Exceptional $111,243 |
| Immigrants | Argentina | 98.5 /100 | #89 | Exceptional $110,873 |
| Northern Europeans | 98.3 /100 | #90 | Exceptional $110,635 |
| Immigrants | Southern Europe | 98.3 /100 | #91 | Exceptional $110,614 |
| Immigrants | Lebanon | 97.9 /100 | #92 | Exceptional $110,159 |
| Immigrants | Kazakhstan | 97.8 /100 | #93 | Exceptional $110,137 |
| Koreans | 97.8 /100 | #94 | Exceptional $110,103 |
| Zimbabweans | 97.7 /100 | #95 | Exceptional $110,011 |
| Immigrants | Moldova | 97.7 /100 | #96 | Exceptional $109,975 |
| Jordanians | 97.5 /100 | #97 | Exceptional $109,865 |
| Immigrants | Kuwait | 97.4 /100 | #98 | Exceptional $109,731 |
| Armenians | 97.3 /100 | #99 | Exceptional $109,692 |
Demographics Similar to Immigrants from Korea by Median Family Income
In terms of median family income, the demographic groups most similar to Immigrants from Korea are Immigrants from Sweden ($122,765, a difference of 0.030%), Immigrants from Japan ($122,764, a difference of 0.030%), Burmese ($123,369, a difference of 0.46%), Immigrants from Northern Europe ($121,840, a difference of 0.79%), and Immigrants from Belgium ($123,831, a difference of 0.84%).
| Demographics | Rating | Rank | Median Family Income |
| Immigrants | South Central Asia | 100.0 /100 | #14 | Exceptional $125,956 |
| Eastern Europeans | 100.0 /100 | #15 | Exceptional $125,546 |
| Immigrants | China | 100.0 /100 | #16 | Exceptional $125,540 |
| Indians (Asian) | 100.0 /100 | #17 | Exceptional $125,312 |
| Immigrants | Eastern Asia | 100.0 /100 | #18 | Exceptional $125,150 |
| Immigrants | Belgium | 100.0 /100 | #19 | Exceptional $123,831 |
| Burmese | 100.0 /100 | #20 | Exceptional $123,369 |
| Immigrants | Korea | 100.0 /100 | #21 | Exceptional $122,800 |
| Immigrants | Sweden | 100.0 /100 | #22 | Exceptional $122,765 |
| Immigrants | Japan | 100.0 /100 | #23 | Exceptional $122,764 |
| Immigrants | Northern Europe | 100.0 /100 | #24 | Exceptional $121,840 |
| Turks | 100.0 /100 | #25 | Exceptional $121,202 |
| Immigrants | Switzerland | 100.0 /100 | #26 | Exceptional $120,726 |
| Russians | 100.0 /100 | #27 | Exceptional $120,487 |
| Immigrants | Denmark | 100.0 /100 | #28 | Exceptional $120,445 |