Cheyenne vs Immigrants from Eastern Europe Child Poverty Among Boys Under 16
COMPARE
Cheyenne
Immigrants from Eastern Europe
Child Poverty Among Boys Under 16
Child Poverty Among Boys Under 16 Comparison
Cheyenne
Immigrants from Eastern Europe
25.8%
CHILD POVERTY AMONG BOYS UNDER 16
0.0/ 100
METRIC RATING
337th/ 347
METRIC RANK
14.7%
CHILD POVERTY AMONG BOYS UNDER 16
97.8/ 100
METRIC RATING
79th/ 347
METRIC RANK
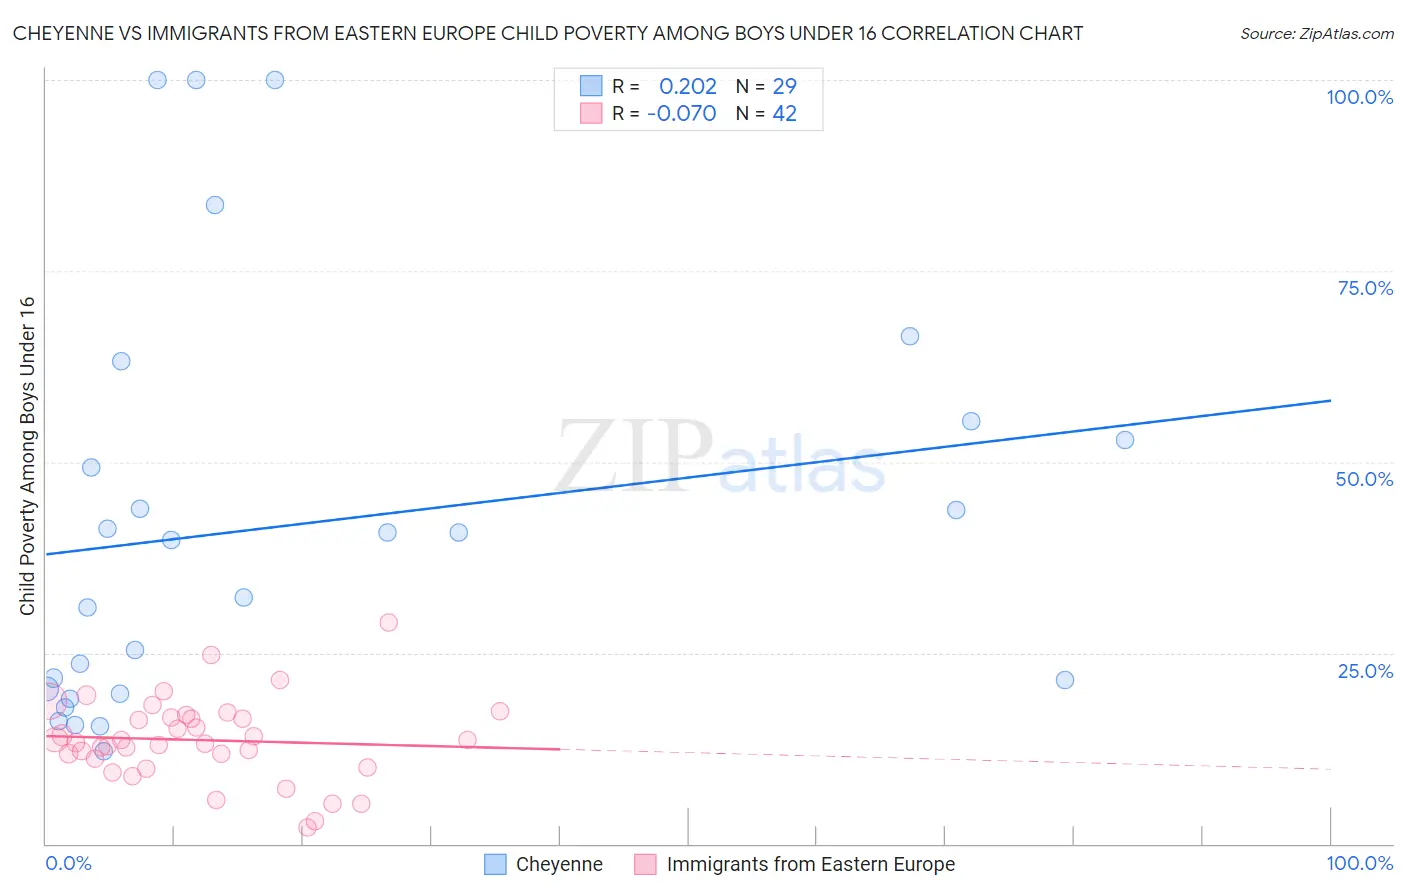
Cheyenne vs Immigrants from Eastern Europe Child Poverty Among Boys Under 16 Correlation Chart
The statistical analysis conducted on geographies consisting of 80,373,873 people shows a weak positive correlation between the proportion of Cheyenne and poverty level among boys under the age of 16 in the United States with a correlation coefficient (R) of 0.202 and weighted average of 25.8%. Similarly, the statistical analysis conducted on geographies consisting of 463,403,145 people shows a slight negative correlation between the proportion of Immigrants from Eastern Europe and poverty level among boys under the age of 16 in the United States with a correlation coefficient (R) of -0.070 and weighted average of 14.7%, a difference of 75.6%.
Child Poverty Among Boys Under 16 Correlation Summary
| Measurement | Cheyenne | Immigrants from Eastern Europe |
| Minimum | 12.2% | 2.2% |
| Maximum | 100.0% | 28.9% |
| Range | 87.8% | 26.7% |
| Mean | 41.8% | 13.6% |
| Median | 39.8% | 13.4% |
| Interquartile 25% (IQ1) | 20.0% | 11.2% |
| Interquartile 75% (IQ3) | 54.1% | 16.5% |
| Interquartile Range (IQR) | 34.1% | 5.3% |
| Standard Deviation (Sample) | 26.7% | 5.4% |
| Standard Deviation (Population) | 26.2% | 5.3% |
Similar Demographics by Child Poverty Among Boys Under 16
Demographics Similar to Cheyenne by Child Poverty Among Boys Under 16
In terms of child poverty among boys under 16, the demographic groups most similar to Cheyenne are Hopi (25.9%, a difference of 0.51%), Houma (26.2%, a difference of 1.5%), Crow (26.3%, a difference of 1.7%), Sioux (25.3%, a difference of 2.0%), and Yup'ik (24.7%, a difference of 4.4%).
| Demographics | Rating | Rank | Child Poverty Among Boys Under 16 |
| Colville | 0.0 /100 | #330 | Tragic 24.1% |
| Dominicans | 0.0 /100 | #331 | Tragic 24.2% |
| Immigrants | Dominican Republic | 0.0 /100 | #332 | Tragic 24.3% |
| Apache | 0.0 /100 | #333 | Tragic 24.5% |
| Blacks/African Americans | 0.0 /100 | #334 | Tragic 24.5% |
| Yup'ik | 0.0 /100 | #335 | Tragic 24.7% |
| Sioux | 0.0 /100 | #336 | Tragic 25.3% |
| Cheyenne | 0.0 /100 | #337 | Tragic 25.8% |
| Hopi | 0.0 /100 | #338 | Tragic 25.9% |
| Houma | 0.0 /100 | #339 | Tragic 26.2% |
| Crow | 0.0 /100 | #340 | Tragic 26.3% |
| Immigrants | Yemen | 0.0 /100 | #341 | Tragic 28.9% |
| Pima | 0.0 /100 | #342 | Tragic 29.7% |
| Navajo | 0.0 /100 | #343 | Tragic 30.3% |
| Yuman | 0.0 /100 | #344 | Tragic 30.6% |
Demographics Similar to Immigrants from Eastern Europe by Child Poverty Among Boys Under 16
In terms of child poverty among boys under 16, the demographic groups most similar to Immigrants from Eastern Europe are Immigrants from Russia (14.7%, a difference of 0.080%), Egyptian (14.7%, a difference of 0.11%), Macedonian (14.7%, a difference of 0.16%), Immigrants from Croatia (14.7%, a difference of 0.22%), and Immigrants from Canada (14.7%, a difference of 0.22%).
| Demographics | Rating | Rank | Child Poverty Among Boys Under 16 |
| Immigrants | Latvia | 98.1 /100 | #72 | Exceptional 14.6% |
| Immigrants | Turkey | 98.0 /100 | #73 | Exceptional 14.6% |
| Australians | 98.0 /100 | #74 | Exceptional 14.7% |
| Immigrants | Poland | 97.9 /100 | #75 | Exceptional 14.7% |
| Immigrants | Croatia | 97.9 /100 | #76 | Exceptional 14.7% |
| Macedonians | 97.9 /100 | #77 | Exceptional 14.7% |
| Egyptians | 97.8 /100 | #78 | Exceptional 14.7% |
| Immigrants | Eastern Europe | 97.8 /100 | #79 | Exceptional 14.7% |
| Immigrants | Russia | 97.7 /100 | #80 | Exceptional 14.7% |
| Immigrants | Canada | 97.6 /100 | #81 | Exceptional 14.7% |
| Ukrainians | 97.6 /100 | #82 | Exceptional 14.7% |
| Immigrants | South Africa | 97.4 /100 | #83 | Exceptional 14.8% |
| Swiss | 97.3 /100 | #84 | Exceptional 14.8% |
| Taiwanese | 97.3 /100 | #85 | Exceptional 14.8% |
| Germans | 97.2 /100 | #86 | Exceptional 14.8% |