Creek vs Immigrants from Belarus Median Female Earnings
COMPARE
Creek
Immigrants from Belarus
Median Female Earnings
Median Female Earnings Comparison
Creek
Immigrants from Belarus
$33,437
MEDIAN FEMALE EARNINGS
0.0/ 100
METRIC RATING
335th/ 347
METRIC RANK
$44,757
MEDIAN FEMALE EARNINGS
100.0/ 100
METRIC RATING
26th/ 347
METRIC RANK
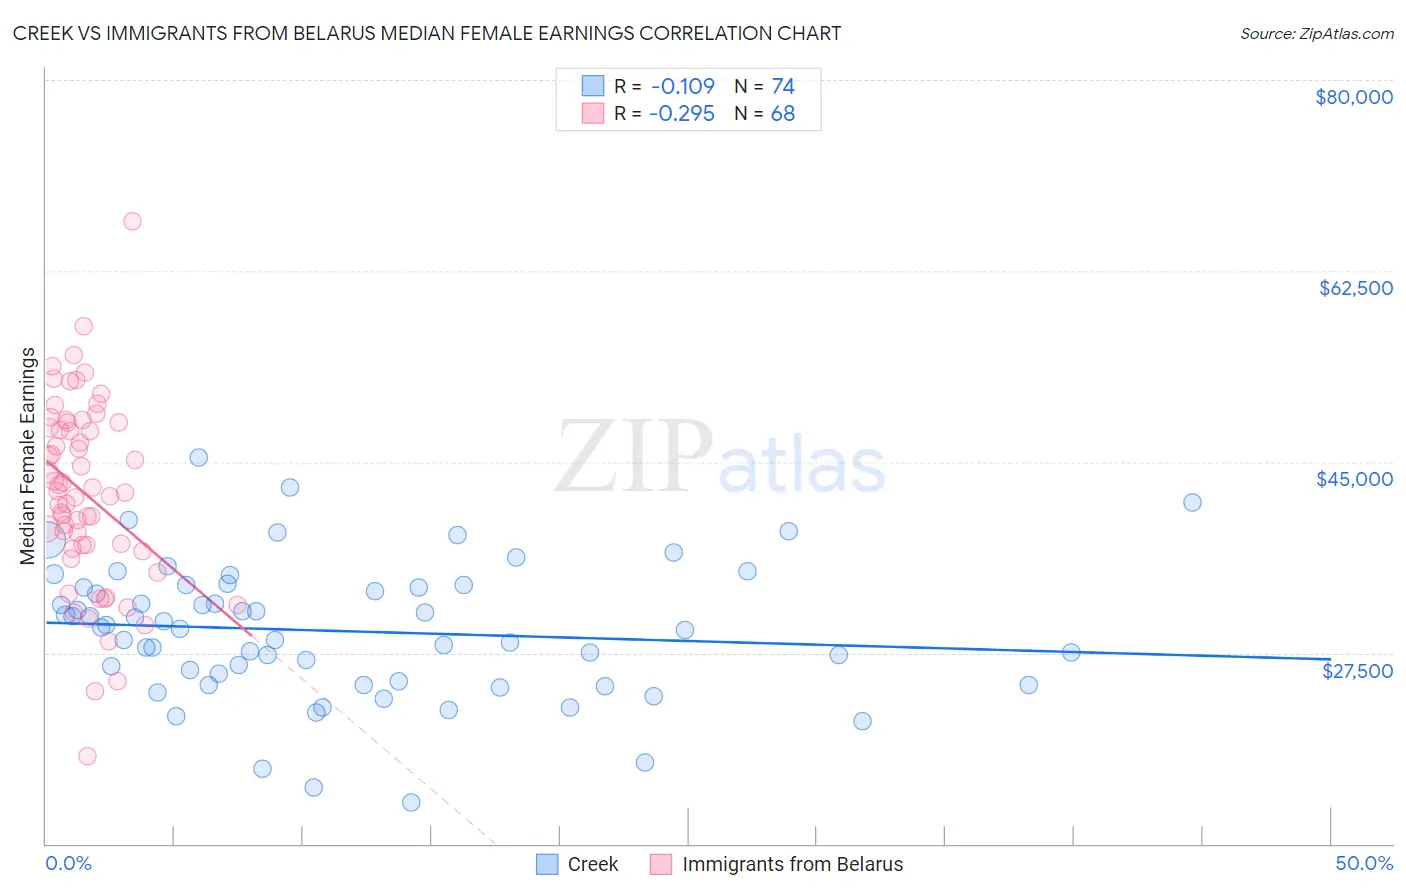
Creek vs Immigrants from Belarus Median Female Earnings Correlation Chart
The statistical analysis conducted on geographies consisting of 178,409,483 people shows a poor negative correlation between the proportion of Creek and median female earnings in the United States with a correlation coefficient (R) of -0.109 and weighted average of $33,437. Similarly, the statistical analysis conducted on geographies consisting of 150,178,879 people shows a weak negative correlation between the proportion of Immigrants from Belarus and median female earnings in the United States with a correlation coefficient (R) of -0.295 and weighted average of $44,757, a difference of 33.9%.
Median Female Earnings Correlation Summary
| Measurement | Creek | Immigrants from Belarus |
| Minimum | $13,750 | $17,969 |
| Maximum | $45,402 | $67,083 |
| Range | $31,652 | $49,114 |
| Mean | $29,490 | $42,072 |
| Median | $29,783 | $42,243 |
| Interquartile 25% (IQ1) | $24,936 | $37,178 |
| Interquartile 75% (IQ3) | $33,500 | $48,362 |
| Interquartile Range (IQR) | $8,564 | $11,183 |
| Standard Deviation (Sample) | $6,205 | $8,617 |
| Standard Deviation (Population) | $6,162 | $8,553 |
Similar Demographics by Median Female Earnings
Demographics Similar to Creek by Median Female Earnings
In terms of median female earnings, the demographic groups most similar to Creek are Ottawa ($33,378, a difference of 0.18%), Yakama ($33,354, a difference of 0.25%), Immigrants from Cuba ($33,291, a difference of 0.44%), Spanish American Indian ($33,625, a difference of 0.56%), and Immigrants from Mexico ($33,236, a difference of 0.61%).
| Demographics | Rating | Rank | Median Female Earnings |
| Immigrants | Central America | 0.0 /100 | #328 | Tragic $33,953 |
| Hopi | 0.0 /100 | #329 | Tragic $33,932 |
| Menominee | 0.0 /100 | #330 | Tragic $33,894 |
| Natives/Alaskans | 0.0 /100 | #331 | Tragic $33,806 |
| Choctaw | 0.0 /100 | #332 | Tragic $33,775 |
| Mexicans | 0.0 /100 | #333 | Tragic $33,664 |
| Spanish American Indians | 0.0 /100 | #334 | Tragic $33,625 |
| Creek | 0.0 /100 | #335 | Tragic $33,437 |
| Ottawa | 0.0 /100 | #336 | Tragic $33,378 |
| Yakama | 0.0 /100 | #337 | Tragic $33,354 |
| Immigrants | Cuba | 0.0 /100 | #338 | Tragic $33,291 |
| Immigrants | Mexico | 0.0 /100 | #339 | Tragic $33,236 |
| Tohono O'odham | 0.0 /100 | #340 | Tragic $33,205 |
| Navajo | 0.0 /100 | #341 | Tragic $33,046 |
| Yup'ik | 0.0 /100 | #342 | Tragic $32,730 |
Demographics Similar to Immigrants from Belarus by Median Female Earnings
In terms of median female earnings, the demographic groups most similar to Immigrants from Belarus are Immigrants from Sweden ($44,774, a difference of 0.040%), Turkish ($44,695, a difference of 0.14%), Immigrants from Russia ($44,680, a difference of 0.17%), Immigrants from Korea ($44,847, a difference of 0.20%), and Burmese ($44,911, a difference of 0.34%).
| Demographics | Rating | Rank | Median Female Earnings |
| Eastern Europeans | 100.0 /100 | #19 | Exceptional $45,385 |
| Immigrants | Japan | 100.0 /100 | #20 | Exceptional $45,323 |
| Cambodians | 100.0 /100 | #21 | Exceptional $45,014 |
| Immigrants | Greece | 100.0 /100 | #22 | Exceptional $44,976 |
| Burmese | 100.0 /100 | #23 | Exceptional $44,911 |
| Immigrants | Korea | 100.0 /100 | #24 | Exceptional $44,847 |
| Immigrants | Sweden | 100.0 /100 | #25 | Exceptional $44,774 |
| Immigrants | Belarus | 100.0 /100 | #26 | Exceptional $44,757 |
| Turks | 100.0 /100 | #27 | Exceptional $44,695 |
| Immigrants | Russia | 100.0 /100 | #28 | Exceptional $44,680 |
| Immigrants | Belgium | 100.0 /100 | #29 | Exceptional $44,587 |
| Asians | 100.0 /100 | #30 | Exceptional $44,586 |
| Immigrants | France | 100.0 /100 | #31 | Exceptional $44,541 |
| Immigrants | Northern Europe | 100.0 /100 | #32 | Exceptional $44,366 |
| Immigrants | Asia | 100.0 /100 | #33 | Exceptional $44,198 |