Somali vs Czechoslovakian Per Capita Income
COMPARE
Somali
Czechoslovakian
Per Capita Income
Per Capita Income Comparison
Somalis
Czechoslovakians
$40,367
PER CAPITA INCOME
2.4/ 100
METRIC RATING
238th/ 347
METRIC RANK
$43,806
PER CAPITA INCOME
54.1/ 100
METRIC RATING
172nd/ 347
METRIC RANK
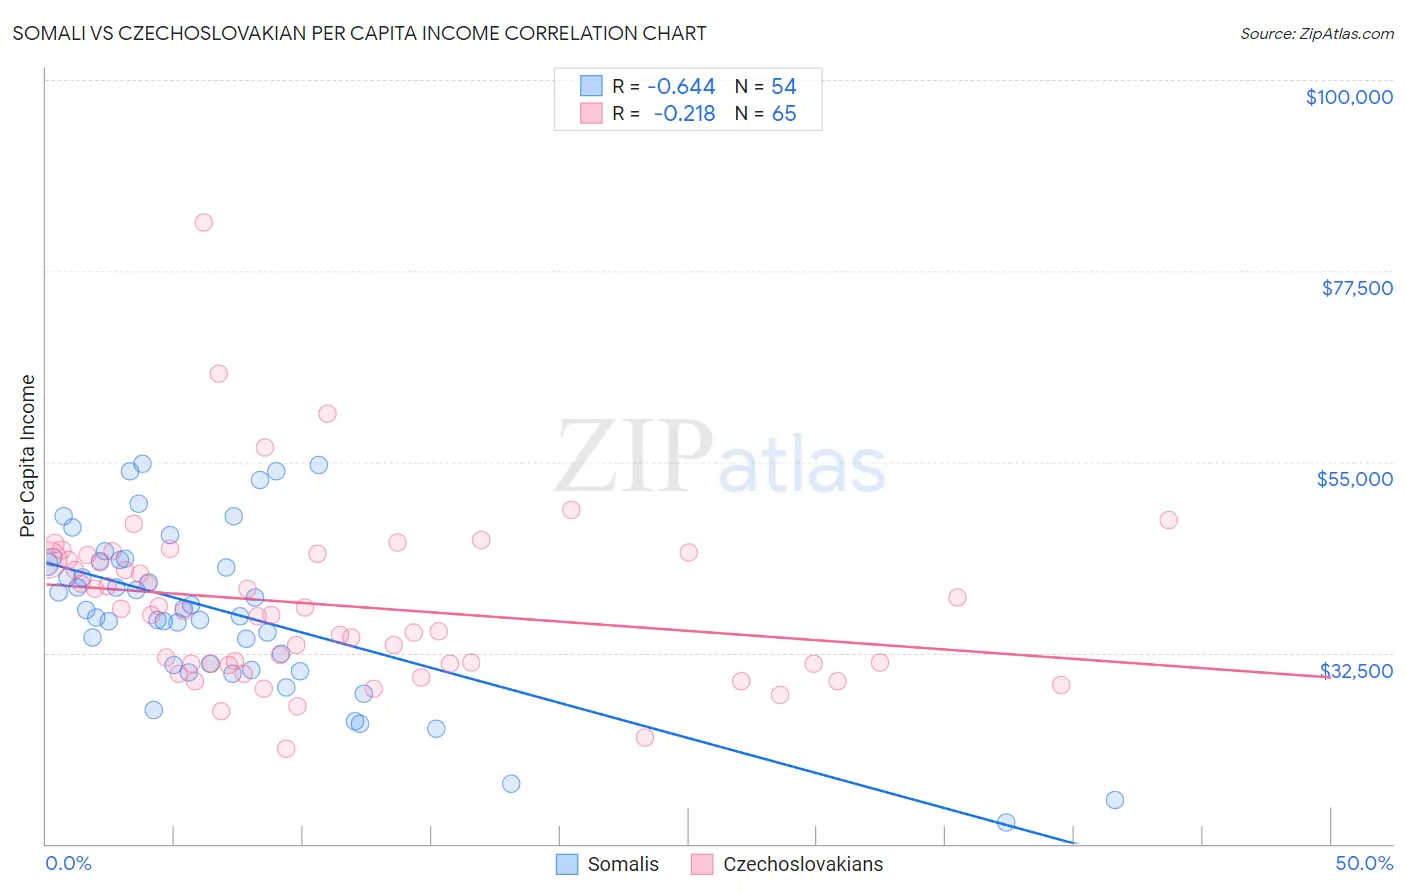
Somali vs Czechoslovakian Per Capita Income Correlation Chart
The statistical analysis conducted on geographies consisting of 99,334,522 people shows a significant negative correlation between the proportion of Somalis and per capita income in the United States with a correlation coefficient (R) of -0.644 and weighted average of $40,367. Similarly, the statistical analysis conducted on geographies consisting of 368,679,879 people shows a weak negative correlation between the proportion of Czechoslovakians and per capita income in the United States with a correlation coefficient (R) of -0.218 and weighted average of $43,806, a difference of 8.5%.
Per Capita Income Correlation Summary
| Measurement | Somali | Czechoslovakian |
| Minimum | $12,576 | $21,167 |
| Maximum | $54,740 | $83,138 |
| Range | $42,164 | $61,971 |
| Mean | $37,481 | $38,118 |
| Median | $37,654 | $36,952 |
| Interquartile 25% (IQ1) | $31,050 | $31,180 |
| Interquartile 75% (IQ3) | $43,455 | $43,747 |
| Interquartile Range (IQR) | $12,404 | $12,567 |
| Standard Deviation (Sample) | $9,737 | $10,239 |
| Standard Deviation (Population) | $9,647 | $10,160 |
Similar Demographics by Per Capita Income
Demographics Similar to Somalis by Per Capita Income
In terms of per capita income, the demographic groups most similar to Somalis are Tsimshian ($40,344, a difference of 0.060%), Immigrants from Nigeria ($40,339, a difference of 0.070%), British West Indian ($40,330, a difference of 0.090%), Immigrants from Cambodia ($40,434, a difference of 0.16%), and Immigrants from Western Africa ($40,294, a difference of 0.18%).
| Demographics | Rating | Rank | Per Capita Income |
| Senegalese | 4.8 /100 | #231 | Tragic $41,000 |
| Guyanese | 4.5 /100 | #232 | Tragic $40,949 |
| Delaware | 3.8 /100 | #233 | Tragic $40,778 |
| Immigrants | West Indies | 3.7 /100 | #234 | Tragic $40,763 |
| Immigrants | Guyana | 3.6 /100 | #235 | Tragic $40,742 |
| Immigrants | Nonimmigrants | 3.4 /100 | #236 | Tragic $40,669 |
| Immigrants | Cambodia | 2.6 /100 | #237 | Tragic $40,434 |
| Somalis | 2.4 /100 | #238 | Tragic $40,367 |
| Tsimshian | 2.4 /100 | #239 | Tragic $40,344 |
| Immigrants | Nigeria | 2.3 /100 | #240 | Tragic $40,339 |
| British West Indians | 2.3 /100 | #241 | Tragic $40,330 |
| Immigrants | Western Africa | 2.2 /100 | #242 | Tragic $40,294 |
| German Russians | 2.2 /100 | #243 | Tragic $40,266 |
| French American Indians | 2.1 /100 | #244 | Tragic $40,244 |
| Sub-Saharan Africans | 1.9 /100 | #245 | Tragic $40,152 |
Demographics Similar to Czechoslovakians by Per Capita Income
In terms of per capita income, the demographic groups most similar to Czechoslovakians are Immigrants from Eastern Africa ($43,838, a difference of 0.070%), Scandinavian ($43,848, a difference of 0.090%), Immigrants from Peru ($43,852, a difference of 0.11%), French ($43,685, a difference of 0.28%), and Belgian ($43,951, a difference of 0.33%).
| Demographics | Rating | Rank | Per Capita Income |
| Immigrants | Philippines | 59.4 /100 | #165 | Average $44,000 |
| Immigrants | Uruguay | 59.3 /100 | #166 | Average $43,997 |
| English | 58.9 /100 | #167 | Average $43,982 |
| Belgians | 58.1 /100 | #168 | Average $43,951 |
| Immigrants | Peru | 55.3 /100 | #169 | Average $43,852 |
| Scandinavians | 55.2 /100 | #170 | Average $43,848 |
| Immigrants | Eastern Africa | 54.9 /100 | #171 | Average $43,838 |
| Czechoslovakians | 54.1 /100 | #172 | Average $43,806 |
| French | 50.7 /100 | #173 | Average $43,685 |
| Colombians | 50.0 /100 | #174 | Average $43,661 |
| Celtics | 48.9 /100 | #175 | Average $43,621 |
| Immigrants | South Eastern Asia | 46.6 /100 | #176 | Average $43,539 |
| Tlingit-Haida | 45.9 /100 | #177 | Average $43,516 |
| Immigrants | Costa Rica | 44.5 /100 | #178 | Average $43,464 |
| Finns | 44.4 /100 | #179 | Average $43,461 |