Syrian vs Czechoslovakian Per Capita Income
COMPARE
Syrian
Czechoslovakian
Per Capita Income
Per Capita Income Comparison
Syrians
Czechoslovakians
$46,837
PER CAPITA INCOME
97.2/ 100
METRIC RATING
103rd/ 347
METRIC RANK
$43,806
PER CAPITA INCOME
54.1/ 100
METRIC RATING
172nd/ 347
METRIC RANK
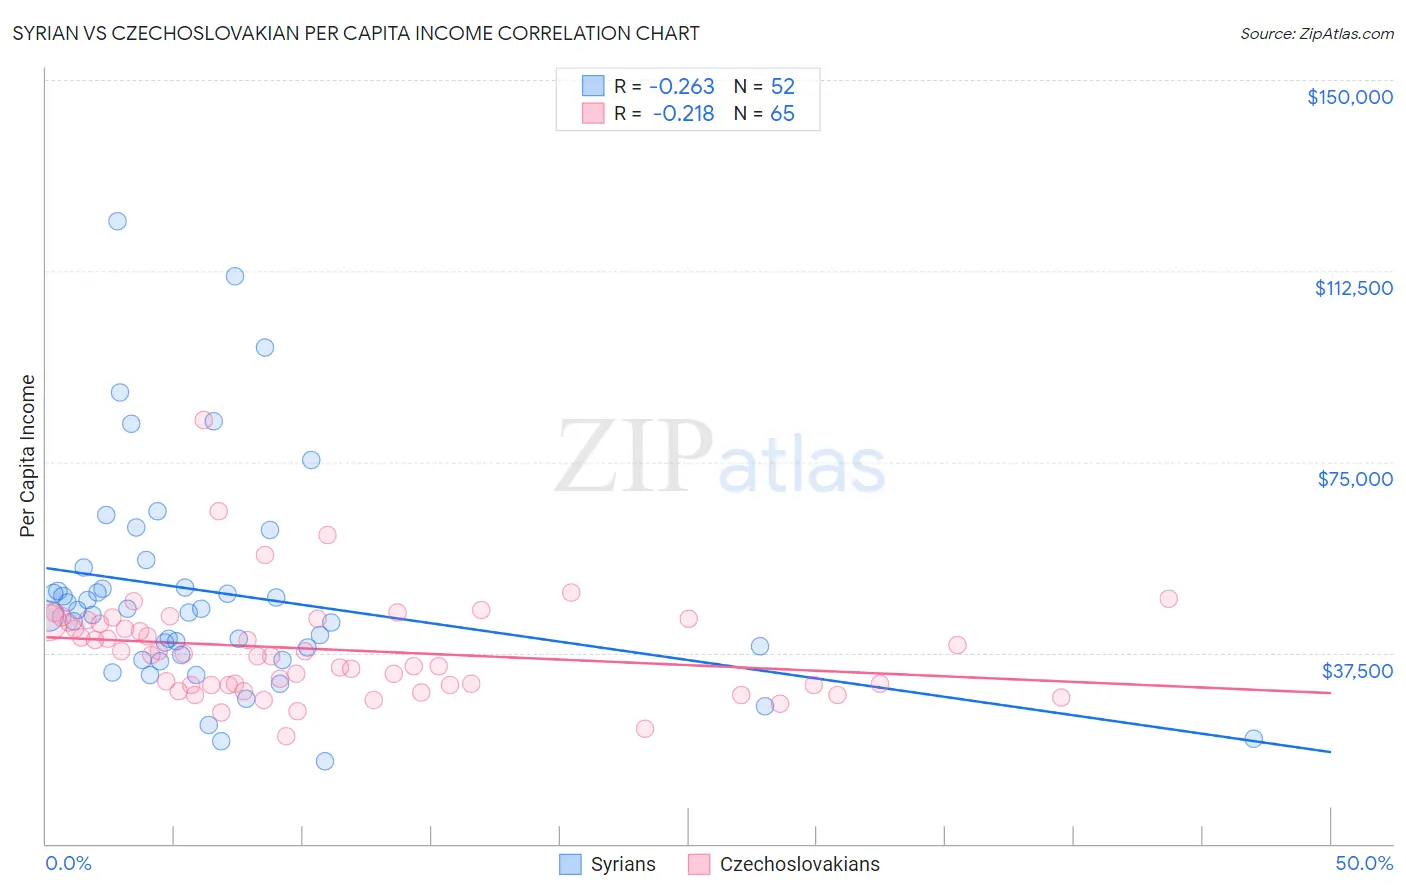
Syrian vs Czechoslovakian Per Capita Income Correlation Chart
The statistical analysis conducted on geographies consisting of 266,332,251 people shows a weak negative correlation between the proportion of Syrians and per capita income in the United States with a correlation coefficient (R) of -0.263 and weighted average of $46,837. Similarly, the statistical analysis conducted on geographies consisting of 368,679,879 people shows a weak negative correlation between the proportion of Czechoslovakians and per capita income in the United States with a correlation coefficient (R) of -0.218 and weighted average of $43,806, a difference of 6.9%.
Per Capita Income Correlation Summary
| Measurement | Syrian | Czechoslovakian |
| Minimum | $16,296 | $21,167 |
| Maximum | $122,379 | $83,138 |
| Range | $106,083 | $61,971 |
| Mean | $49,326 | $38,118 |
| Median | $45,708 | $36,952 |
| Interquartile 25% (IQ1) | $36,580 | $31,180 |
| Interquartile 75% (IQ3) | $52,298 | $43,747 |
| Interquartile Range (IQR) | $15,717 | $12,567 |
| Standard Deviation (Sample) | $21,603 | $10,239 |
| Standard Deviation (Population) | $21,394 | $10,160 |
Similar Demographics by Per Capita Income
Demographics Similar to Syrians by Per Capita Income
In terms of per capita income, the demographic groups most similar to Syrians are Immigrants from Western Asia ($46,876, a difference of 0.080%), Immigrants from Uzbekistan ($46,929, a difference of 0.20%), Immigrants from Lebanon ($46,938, a difference of 0.22%), Brazilian ($46,700, a difference of 0.29%), and Laotian ($47,041, a difference of 0.43%).
| Demographics | Rating | Rank | Per Capita Income |
| Alsatians | 98.3 /100 | #96 | Exceptional $47,284 |
| Carpatho Rusyns | 98.2 /100 | #97 | Exceptional $47,248 |
| Immigrants | Pakistan | 97.9 /100 | #98 | Exceptional $47,084 |
| Laotians | 97.8 /100 | #99 | Exceptional $47,041 |
| Immigrants | Lebanon | 97.5 /100 | #100 | Exceptional $46,938 |
| Immigrants | Uzbekistan | 97.5 /100 | #101 | Exceptional $46,929 |
| Immigrants | Western Asia | 97.4 /100 | #102 | Exceptional $46,876 |
| Syrians | 97.2 /100 | #103 | Exceptional $46,837 |
| Brazilians | 96.8 /100 | #104 | Exceptional $46,700 |
| British | 96.3 /100 | #105 | Exceptional $46,571 |
| Ethiopians | 96.3 /100 | #106 | Exceptional $46,569 |
| Serbians | 96.2 /100 | #107 | Exceptional $46,551 |
| Immigrants | Kuwait | 96.2 /100 | #108 | Exceptional $46,543 |
| Immigrants | Northern Africa | 96.2 /100 | #109 | Exceptional $46,531 |
| Chileans | 95.9 /100 | #110 | Exceptional $46,459 |
Demographics Similar to Czechoslovakians by Per Capita Income
In terms of per capita income, the demographic groups most similar to Czechoslovakians are Immigrants from Eastern Africa ($43,838, a difference of 0.070%), Scandinavian ($43,848, a difference of 0.090%), Immigrants from Peru ($43,852, a difference of 0.11%), French ($43,685, a difference of 0.28%), and Belgian ($43,951, a difference of 0.33%).
| Demographics | Rating | Rank | Per Capita Income |
| Immigrants | Philippines | 59.4 /100 | #165 | Average $44,000 |
| Immigrants | Uruguay | 59.3 /100 | #166 | Average $43,997 |
| English | 58.9 /100 | #167 | Average $43,982 |
| Belgians | 58.1 /100 | #168 | Average $43,951 |
| Immigrants | Peru | 55.3 /100 | #169 | Average $43,852 |
| Scandinavians | 55.2 /100 | #170 | Average $43,848 |
| Immigrants | Eastern Africa | 54.9 /100 | #171 | Average $43,838 |
| Czechoslovakians | 54.1 /100 | #172 | Average $43,806 |
| French | 50.7 /100 | #173 | Average $43,685 |
| Colombians | 50.0 /100 | #174 | Average $43,661 |
| Celtics | 48.9 /100 | #175 | Average $43,621 |
| Immigrants | South Eastern Asia | 46.6 /100 | #176 | Average $43,539 |
| Tlingit-Haida | 45.9 /100 | #177 | Average $43,516 |
| Immigrants | Costa Rica | 44.5 /100 | #178 | Average $43,464 |
| Finns | 44.4 /100 | #179 | Average $43,461 |