Cherokee vs Immigrants from Spain Median Male Earnings
COMPARE
Cherokee
Immigrants from Spain
Median Male Earnings
Median Male Earnings Comparison
Cherokee
Immigrants from Spain
$48,669
MEDIAN MALE EARNINGS
0.3/ 100
METRIC RATING
271st/ 347
METRIC RANK
$60,750
MEDIAN MALE EARNINGS
99.8/ 100
METRIC RATING
67th/ 347
METRIC RANK
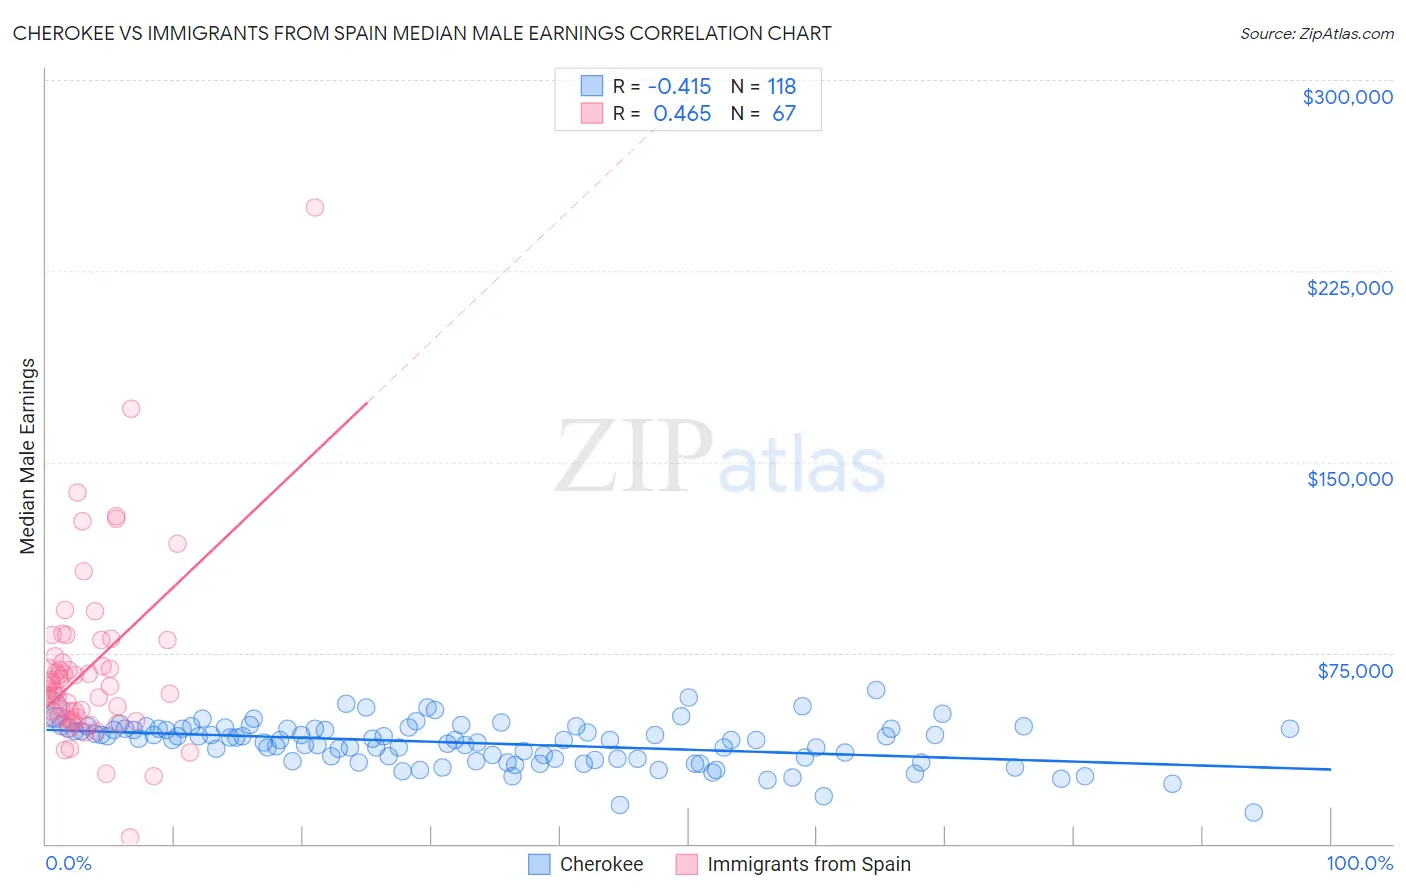
Cherokee vs Immigrants from Spain Median Male Earnings Correlation Chart
The statistical analysis conducted on geographies consisting of 493,193,856 people shows a moderate negative correlation between the proportion of Cherokee and median male earnings in the United States with a correlation coefficient (R) of -0.415 and weighted average of $48,669. Similarly, the statistical analysis conducted on geographies consisting of 239,649,237 people shows a moderate positive correlation between the proportion of Immigrants from Spain and median male earnings in the United States with a correlation coefficient (R) of 0.465 and weighted average of $60,750, a difference of 24.8%.
Median Male Earnings Correlation Summary
| Measurement | Cherokee | Immigrants from Spain |
| Minimum | $12,361 | $2,499 |
| Maximum | $60,438 | $250,001 |
| Range | $48,077 | $247,502 |
| Mean | $39,586 | $68,720 |
| Median | $40,957 | $60,260 |
| Interquartile 25% (IQ1) | $33,308 | $49,576 |
| Interquartile 75% (IQ3) | $45,365 | $73,651 |
| Interquartile Range (IQR) | $12,057 | $24,075 |
| Standard Deviation (Sample) | $8,544 | $35,640 |
| Standard Deviation (Population) | $8,508 | $35,373 |
Similar Demographics by Median Male Earnings
Demographics Similar to Cherokee by Median Male Earnings
In terms of median male earnings, the demographic groups most similar to Cherokee are Salvadoran ($48,646, a difference of 0.050%), Jamaican ($48,632, a difference of 0.080%), Potawatomi ($48,768, a difference of 0.20%), Colville ($48,516, a difference of 0.32%), and Tsimshian ($48,836, a difference of 0.34%).
| Demographics | Rating | Rank | Median Male Earnings |
| Immigrants | Middle Africa | 0.6 /100 | #264 | Tragic $49,201 |
| Immigrants | Laos | 0.6 /100 | #265 | Tragic $49,190 |
| Somalis | 0.5 /100 | #266 | Tragic $49,025 |
| Spanish Americans | 0.5 /100 | #267 | Tragic $49,008 |
| Ute | 0.4 /100 | #268 | Tragic $48,899 |
| Tsimshian | 0.4 /100 | #269 | Tragic $48,836 |
| Potawatomi | 0.4 /100 | #270 | Tragic $48,768 |
| Cherokee | 0.3 /100 | #271 | Tragic $48,669 |
| Salvadorans | 0.3 /100 | #272 | Tragic $48,646 |
| Jamaicans | 0.3 /100 | #273 | Tragic $48,632 |
| Colville | 0.3 /100 | #274 | Tragic $48,516 |
| Immigrants | Somalia | 0.3 /100 | #275 | Tragic $48,439 |
| Blackfeet | 0.3 /100 | #276 | Tragic $48,402 |
| Belizeans | 0.2 /100 | #277 | Tragic $48,358 |
| Immigrants | Liberia | 0.2 /100 | #278 | Tragic $48,317 |
Demographics Similar to Immigrants from Spain by Median Male Earnings
In terms of median male earnings, the demographic groups most similar to Immigrants from Spain are Immigrants from Serbia ($60,600, a difference of 0.25%), Immigrants from Croatia ($60,914, a difference of 0.27%), Immigrants from Indonesia ($60,935, a difference of 0.30%), Immigrants from Eastern Europe ($60,958, a difference of 0.34%), and Immigrants from Pakistan ($60,987, a difference of 0.39%).
| Demographics | Rating | Rank | Median Male Earnings |
| Egyptians | 99.8 /100 | #60 | Exceptional $61,095 |
| Bolivians | 99.8 /100 | #61 | Exceptional $61,066 |
| Immigrants | Romania | 99.8 /100 | #62 | Exceptional $61,040 |
| Immigrants | Pakistan | 99.8 /100 | #63 | Exceptional $60,987 |
| Immigrants | Eastern Europe | 99.8 /100 | #64 | Exceptional $60,958 |
| Immigrants | Indonesia | 99.8 /100 | #65 | Exceptional $60,935 |
| Immigrants | Croatia | 99.8 /100 | #66 | Exceptional $60,914 |
| Immigrants | Spain | 99.8 /100 | #67 | Exceptional $60,750 |
| Immigrants | Serbia | 99.7 /100 | #68 | Exceptional $60,600 |
| Immigrants | Canada | 99.7 /100 | #69 | Exceptional $60,388 |
| Immigrants | Bulgaria | 99.7 /100 | #70 | Exceptional $60,358 |
| Mongolians | 99.7 /100 | #71 | Exceptional $60,350 |
| Immigrants | Western Europe | 99.7 /100 | #72 | Exceptional $60,334 |
| Immigrants | North America | 99.7 /100 | #73 | Exceptional $60,265 |
| Argentineans | 99.6 /100 | #74 | Exceptional $60,117 |