Cherokee vs Liberian Median Male Earnings
COMPARE
Cherokee
Liberian
Median Male Earnings
Median Male Earnings Comparison
Cherokee
Liberians
$48,669
MEDIAN MALE EARNINGS
0.3/ 100
METRIC RATING
271st/ 347
METRIC RANK
$49,318
MEDIAN MALE EARNINGS
0.6/ 100
METRIC RATING
261st/ 347
METRIC RANK
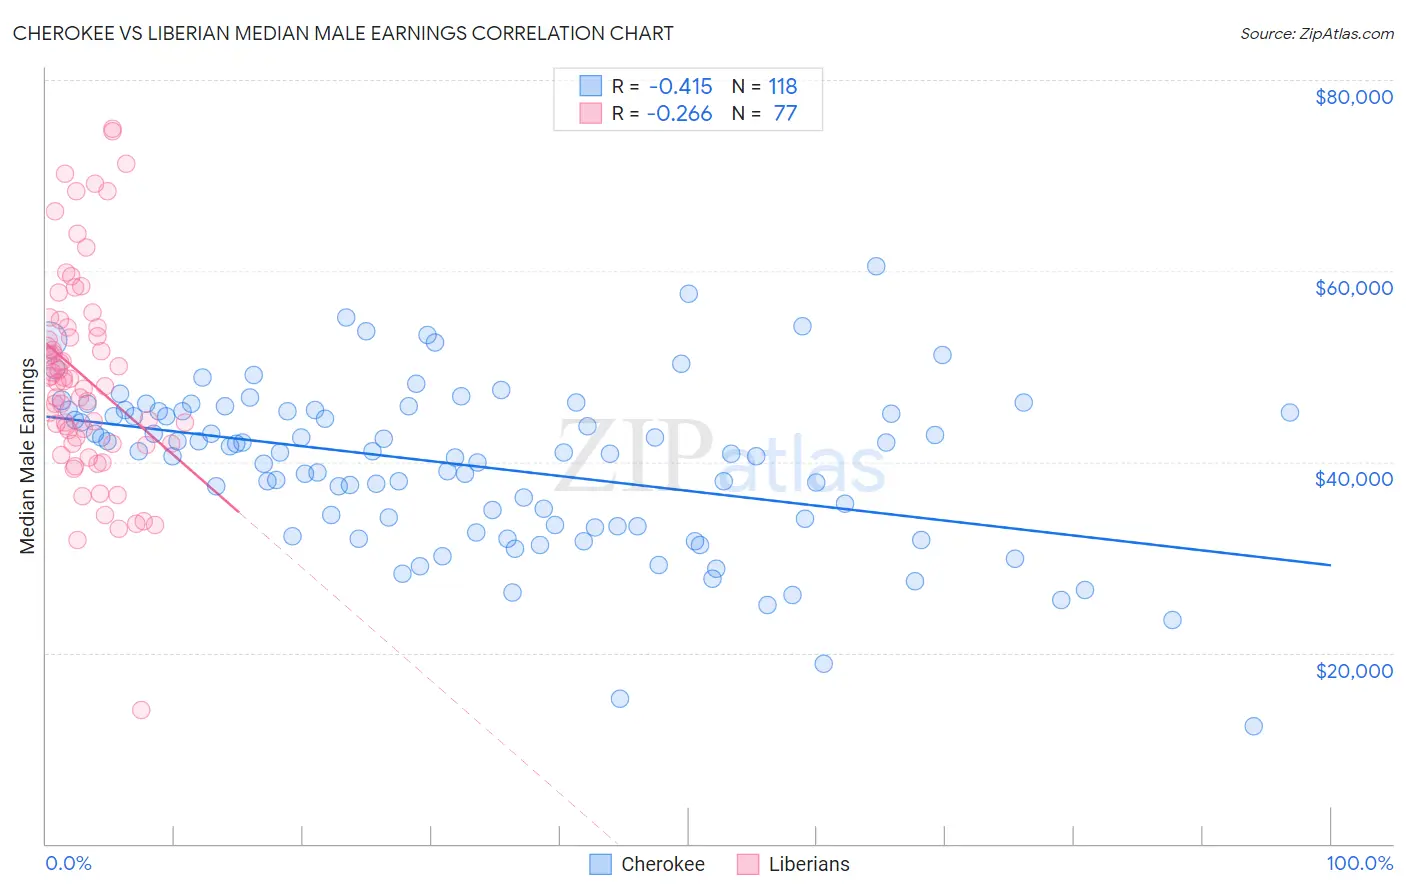
Cherokee vs Liberian Median Male Earnings Correlation Chart
The statistical analysis conducted on geographies consisting of 493,193,856 people shows a moderate negative correlation between the proportion of Cherokee and median male earnings in the United States with a correlation coefficient (R) of -0.415 and weighted average of $48,669. Similarly, the statistical analysis conducted on geographies consisting of 118,095,267 people shows a weak negative correlation between the proportion of Liberians and median male earnings in the United States with a correlation coefficient (R) of -0.266 and weighted average of $49,318, a difference of 1.3%.
Median Male Earnings Correlation Summary
| Measurement | Cherokee | Liberian |
| Minimum | $12,361 | $14,075 |
| Maximum | $60,438 | $74,924 |
| Range | $48,077 | $60,849 |
| Mean | $39,586 | $48,884 |
| Median | $40,957 | $48,498 |
| Interquartile 25% (IQ1) | $33,308 | $41,872 |
| Interquartile 75% (IQ3) | $45,365 | $54,038 |
| Interquartile Range (IQR) | $12,057 | $12,166 |
| Standard Deviation (Sample) | $8,544 | $10,904 |
| Standard Deviation (Population) | $8,508 | $10,833 |
Demographics Similar to Cherokee and Liberians by Median Male Earnings
In terms of median male earnings, the demographic groups most similar to Cherokee are Salvadoran ($48,646, a difference of 0.050%), Jamaican ($48,632, a difference of 0.080%), Potawatomi ($48,768, a difference of 0.20%), Colville ($48,516, a difference of 0.32%), and Tsimshian ($48,836, a difference of 0.34%). Similarly, the demographic groups most similar to Liberians are Immigrants from West Indies ($49,271, a difference of 0.10%), Iroquois ($49,374, a difference of 0.11%), Nicaraguan ($49,215, a difference of 0.21%), Immigrants from Middle Africa ($49,201, a difference of 0.24%), and Immigrants from Laos ($49,190, a difference of 0.26%).
| Demographics | Rating | Rank | Median Male Earnings |
| Alaska Natives | 0.9 /100 | #256 | Tragic $49,711 |
| British West Indians | 0.8 /100 | #257 | Tragic $49,636 |
| Cree | 0.7 /100 | #258 | Tragic $49,497 |
| Nepalese | 0.7 /100 | #259 | Tragic $49,458 |
| Iroquois | 0.7 /100 | #260 | Tragic $49,374 |
| Liberians | 0.6 /100 | #261 | Tragic $49,318 |
| Immigrants | West Indies | 0.6 /100 | #262 | Tragic $49,271 |
| Nicaraguans | 0.6 /100 | #263 | Tragic $49,215 |
| Immigrants | Middle Africa | 0.6 /100 | #264 | Tragic $49,201 |
| Immigrants | Laos | 0.6 /100 | #265 | Tragic $49,190 |
| Somalis | 0.5 /100 | #266 | Tragic $49,025 |
| Spanish Americans | 0.5 /100 | #267 | Tragic $49,008 |
| Ute | 0.4 /100 | #268 | Tragic $48,899 |
| Tsimshian | 0.4 /100 | #269 | Tragic $48,836 |
| Potawatomi | 0.4 /100 | #270 | Tragic $48,768 |
| Cherokee | 0.3 /100 | #271 | Tragic $48,669 |
| Salvadorans | 0.3 /100 | #272 | Tragic $48,646 |
| Jamaicans | 0.3 /100 | #273 | Tragic $48,632 |
| Colville | 0.3 /100 | #274 | Tragic $48,516 |
| Immigrants | Somalia | 0.3 /100 | #275 | Tragic $48,439 |
| Blackfeet | 0.3 /100 | #276 | Tragic $48,402 |