Cherokee vs West Indian Householder Income Under 25 years
COMPARE
Cherokee
West Indian
Householder Income Under 25 years
Householder Income Under 25 years Comparison
Cherokee
West Indians
$47,848
HOUSEHOLDER INCOME UNDER 25 YEARS
0.0/ 100
METRIC RATING
305th/ 347
METRIC RANK
$51,583
HOUSEHOLDER INCOME UNDER 25 YEARS
18.5/ 100
METRIC RATING
192nd/ 347
METRIC RANK
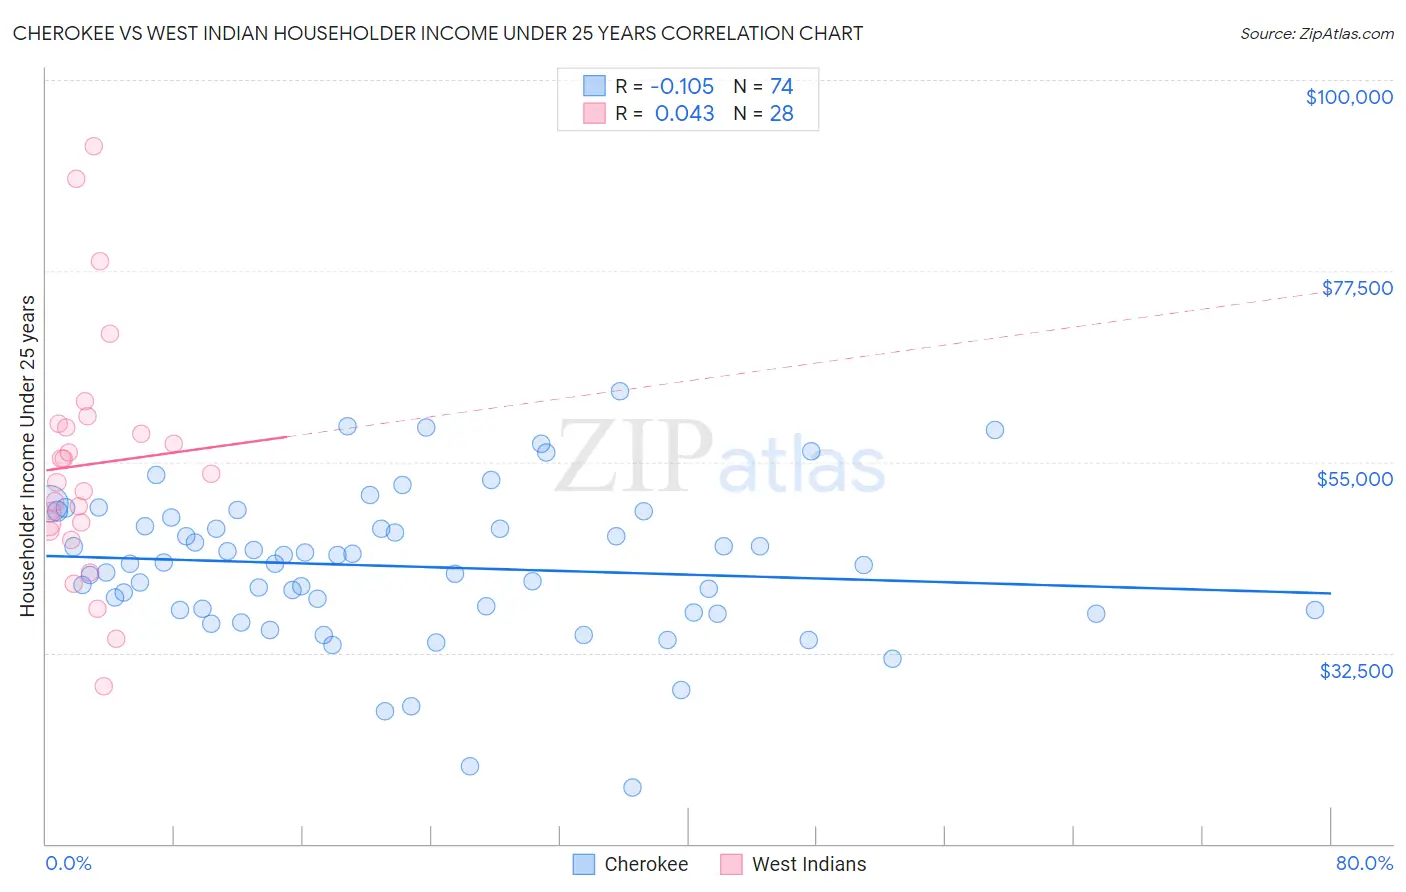
Cherokee vs West Indian Householder Income Under 25 years Correlation Chart
The statistical analysis conducted on geographies consisting of 404,177,711 people shows a poor negative correlation between the proportion of Cherokee and household income with householder under the age of 25 in the United States with a correlation coefficient (R) of -0.105 and weighted average of $47,848. Similarly, the statistical analysis conducted on geographies consisting of 221,989,526 people shows no correlation between the proportion of West Indians and household income with householder under the age of 25 in the United States with a correlation coefficient (R) of 0.043 and weighted average of $51,583, a difference of 7.8%.
Householder Income Under 25 years Correlation Summary
| Measurement | Cherokee | West Indian |
| Minimum | $16,563 | $28,623 |
| Maximum | $63,295 | $92,155 |
| Range | $46,732 | $63,532 |
| Mean | $42,680 | $54,678 |
| Median | $43,010 | $53,085 |
| Interquartile 25% (IQ1) | $37,476 | $47,297 |
| Interquartile 75% (IQ3) | $47,453 | $59,304 |
| Interquartile Range (IQR) | $9,977 | $12,007 |
| Standard Deviation (Sample) | $8,797 | $14,375 |
| Standard Deviation (Population) | $8,737 | $14,116 |
Similar Demographics by Householder Income Under 25 years
Demographics Similar to Cherokee by Householder Income Under 25 years
In terms of householder income under 25 years, the demographic groups most similar to Cherokee are Menominee ($47,907, a difference of 0.12%), Immigrants from Middle Africa ($47,916, a difference of 0.14%), Immigrants from Liberia ($47,981, a difference of 0.28%), Native/Alaskan ($47,704, a difference of 0.30%), and Bangladeshi ($47,589, a difference of 0.55%).
| Demographics | Rating | Rank | Householder Income Under 25 years |
| Yaqui | 0.0 /100 | #298 | Tragic $48,300 |
| Immigrants | Honduras | 0.0 /100 | #299 | Tragic $48,267 |
| Immigrants | Somalia | 0.0 /100 | #300 | Tragic $48,135 |
| Immigrants | Kuwait | 0.0 /100 | #301 | Tragic $48,126 |
| Immigrants | Liberia | 0.0 /100 | #302 | Tragic $47,981 |
| Immigrants | Middle Africa | 0.0 /100 | #303 | Tragic $47,916 |
| Menominee | 0.0 /100 | #304 | Tragic $47,907 |
| Cherokee | 0.0 /100 | #305 | Tragic $47,848 |
| Natives/Alaskans | 0.0 /100 | #306 | Tragic $47,704 |
| Bangladeshis | 0.0 /100 | #307 | Tragic $47,589 |
| Comanche | 0.0 /100 | #308 | Tragic $47,518 |
| U.S. Virgin Islanders | 0.0 /100 | #309 | Tragic $47,448 |
| Iroquois | 0.0 /100 | #310 | Tragic $47,380 |
| Ottawa | 0.0 /100 | #311 | Tragic $47,366 |
| Bermudans | 0.0 /100 | #312 | Tragic $47,359 |
Demographics Similar to West Indians by Householder Income Under 25 years
In terms of householder income under 25 years, the demographic groups most similar to West Indians are Immigrants from Eritrea ($51,574, a difference of 0.020%), Malaysian ($51,615, a difference of 0.060%), Panamanian ($51,611, a difference of 0.060%), Guatemalan ($51,525, a difference of 0.11%), and Estonian ($51,523, a difference of 0.12%).
| Demographics | Rating | Rank | Householder Income Under 25 years |
| Immigrants | Latvia | 24.8 /100 | #185 | Fair $51,737 |
| Alaskan Athabascans | 23.8 /100 | #186 | Fair $51,713 |
| Immigrants | South Africa | 23.4 /100 | #187 | Fair $51,705 |
| Northern Europeans | 22.2 /100 | #188 | Fair $51,678 |
| Croatians | 21.6 /100 | #189 | Fair $51,662 |
| Malaysians | 19.7 /100 | #190 | Poor $51,615 |
| Panamanians | 19.5 /100 | #191 | Poor $51,611 |
| West Indians | 18.5 /100 | #192 | Poor $51,583 |
| Immigrants | Eritrea | 18.1 /100 | #193 | Poor $51,574 |
| Guatemalans | 16.4 /100 | #194 | Poor $51,525 |
| Estonians | 16.4 /100 | #195 | Poor $51,523 |
| Palestinians | 16.1 /100 | #196 | Poor $51,515 |
| Pima | 15.7 /100 | #197 | Poor $51,503 |
| Immigrants | Syria | 15.4 /100 | #198 | Poor $51,494 |
| Swiss | 15.4 /100 | #199 | Poor $51,493 |