Cherokee vs Immigrants from Peru Householder Income Ages 45 - 64 years
COMPARE
Cherokee
Immigrants from Peru
Householder Income Ages 45 - 64 years
Householder Income Ages 45 - 64 years Comparison
Cherokee
Immigrants from Peru
$86,125
HOUSEHOLDER INCOME AGES 45 - 64 YEARS
0.1/ 100
METRIC RATING
290th/ 347
METRIC RANK
$103,173
HOUSEHOLDER INCOME AGES 45 - 64 YEARS
80.7/ 100
METRIC RATING
150th/ 347
METRIC RANK
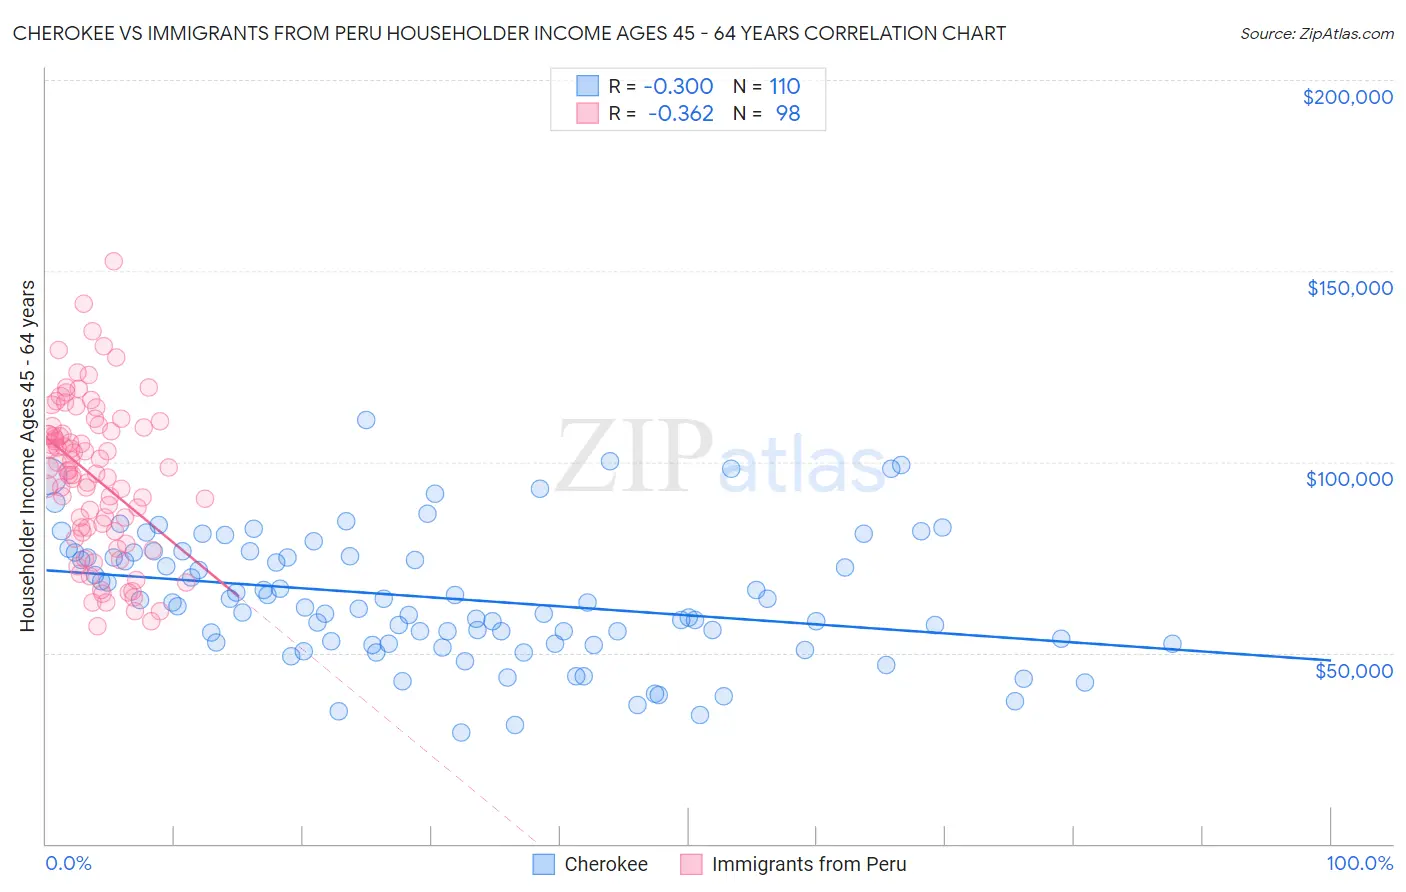
Cherokee vs Immigrants from Peru Householder Income Ages 45 - 64 years Correlation Chart
The statistical analysis conducted on geographies consisting of 491,799,921 people shows a mild negative correlation between the proportion of Cherokee and household income with householder between the ages 45 and 64 in the United States with a correlation coefficient (R) of -0.300 and weighted average of $86,125. Similarly, the statistical analysis conducted on geographies consisting of 328,568,384 people shows a mild negative correlation between the proportion of Immigrants from Peru and household income with householder between the ages 45 and 64 in the United States with a correlation coefficient (R) of -0.362 and weighted average of $103,173, a difference of 19.8%.
Householder Income Ages 45 - 64 years Correlation Summary
| Measurement | Cherokee | Immigrants from Peru |
| Minimum | $29,177 | $56,875 |
| Maximum | $110,921 | $152,612 |
| Range | $81,743 | $95,737 |
| Mean | $64,277 | $96,084 |
| Median | $62,715 | $97,801 |
| Interquartile 25% (IQ1) | $52,500 | $81,677 |
| Interquartile 75% (IQ3) | $76,245 | $109,063 |
| Interquartile Range (IQR) | $23,745 | $27,386 |
| Standard Deviation (Sample) | $16,781 | $20,026 |
| Standard Deviation (Population) | $16,705 | $19,924 |
Similar Demographics by Householder Income Ages 45 - 64 years
Demographics Similar to Cherokee by Householder Income Ages 45 - 64 years
In terms of householder income ages 45 - 64 years, the demographic groups most similar to Cherokee are Hispanic or Latino ($86,006, a difference of 0.14%), Immigrants from Central America ($85,965, a difference of 0.19%), Cuban ($86,301, a difference of 0.20%), Immigrants from St. Vincent and the Grenadines ($86,394, a difference of 0.31%), and Bangladeshi ($86,402, a difference of 0.32%).
| Demographics | Rating | Rank | Householder Income Ages 45 - 64 years |
| Mexicans | 0.1 /100 | #283 | Tragic $86,816 |
| Central American Indians | 0.1 /100 | #284 | Tragic $86,764 |
| Blackfeet | 0.1 /100 | #285 | Tragic $86,595 |
| Immigrants | Guatemala | 0.1 /100 | #286 | Tragic $86,573 |
| Bangladeshis | 0.1 /100 | #287 | Tragic $86,402 |
| Immigrants | St. Vincent and the Grenadines | 0.1 /100 | #288 | Tragic $86,394 |
| Cubans | 0.1 /100 | #289 | Tragic $86,301 |
| Cherokee | 0.1 /100 | #290 | Tragic $86,125 |
| Hispanics or Latinos | 0.1 /100 | #291 | Tragic $86,006 |
| Immigrants | Central America | 0.1 /100 | #292 | Tragic $85,965 |
| Comanche | 0.1 /100 | #293 | Tragic $85,787 |
| British West Indians | 0.1 /100 | #294 | Tragic $85,571 |
| Immigrants | Grenada | 0.1 /100 | #295 | Tragic $85,552 |
| Immigrants | Zaire | 0.1 /100 | #296 | Tragic $85,207 |
| Fijians | 0.1 /100 | #297 | Tragic $85,187 |
Demographics Similar to Immigrants from Peru by Householder Income Ages 45 - 64 years
In terms of householder income ages 45 - 64 years, the demographic groups most similar to Immigrants from Peru are Immigrants from Sierra Leone ($103,227, a difference of 0.050%), Swiss ($103,071, a difference of 0.10%), Irish ($103,067, a difference of 0.10%), Immigrants from Germany ($103,282, a difference of 0.11%), and Scandinavian ($102,969, a difference of 0.20%).
| Demographics | Rating | Rank | Householder Income Ages 45 - 64 years |
| Serbians | 83.2 /100 | #143 | Excellent $103,522 |
| Czechs | 83.1 /100 | #144 | Excellent $103,507 |
| Ugandans | 82.9 /100 | #145 | Excellent $103,472 |
| Immigrants | Chile | 82.5 /100 | #146 | Excellent $103,412 |
| Basques | 82.3 /100 | #147 | Excellent $103,387 |
| Immigrants | Germany | 81.5 /100 | #148 | Excellent $103,282 |
| Immigrants | Sierra Leone | 81.1 /100 | #149 | Excellent $103,227 |
| Immigrants | Peru | 80.7 /100 | #150 | Excellent $103,173 |
| Swiss | 79.9 /100 | #151 | Good $103,071 |
| Irish | 79.8 /100 | #152 | Good $103,067 |
| Scandinavians | 79.0 /100 | #153 | Good $102,969 |
| Slovenes | 78.3 /100 | #154 | Good $102,885 |
| Costa Ricans | 77.4 /100 | #155 | Good $102,779 |
| Carpatho Rusyns | 77.4 /100 | #156 | Good $102,777 |
| Immigrants | Ethiopia | 77.3 /100 | #157 | Good $102,763 |