Cherokee vs Black/African American Unemployment Among Youth under 25 years
COMPARE
Cherokee
Black/African American
Unemployment Among Youth under 25 years
Unemployment Among Youth under 25 years Comparison
Cherokee
Blacks/African Americans
11.8%
UNEMPLOYMENT AMONG YOUTH UNDER 25 YEARS
21.2/ 100
METRIC RATING
198th/ 347
METRIC RANK
14.5%
UNEMPLOYMENT AMONG YOUTH UNDER 25 YEARS
0.0/ 100
METRIC RATING
317th/ 347
METRIC RANK
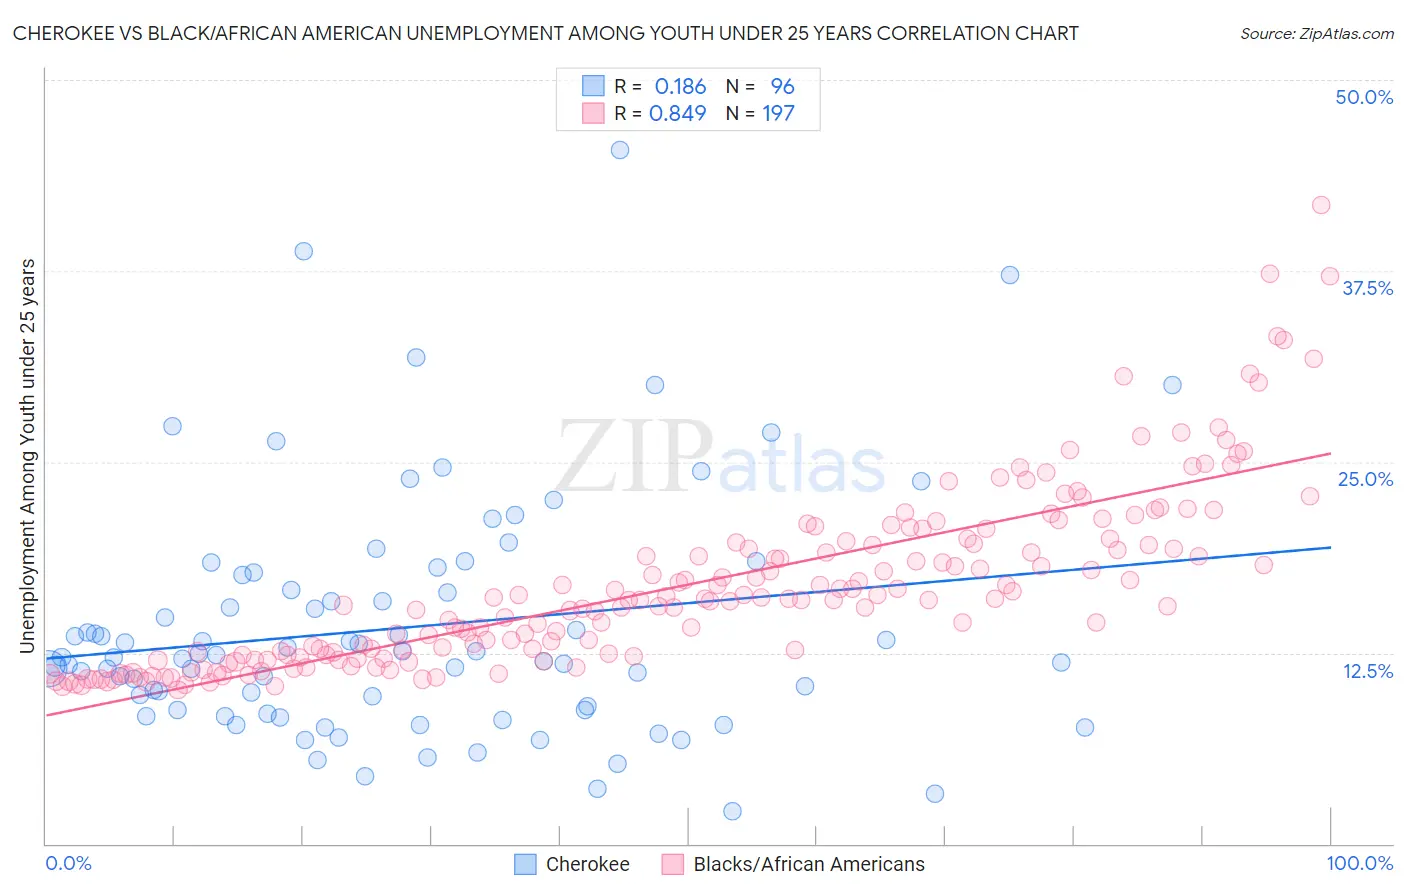
Cherokee vs Black/African American Unemployment Among Youth under 25 years Correlation Chart
The statistical analysis conducted on geographies consisting of 481,576,104 people shows a poor positive correlation between the proportion of Cherokee and unemployment rate among youth under the age of 25 in the United States with a correlation coefficient (R) of 0.186 and weighted average of 11.8%. Similarly, the statistical analysis conducted on geographies consisting of 545,283,249 people shows a very strong positive correlation between the proportion of Blacks/African Americans and unemployment rate among youth under the age of 25 in the United States with a correlation coefficient (R) of 0.849 and weighted average of 14.5%, a difference of 23.1%.
Unemployment Among Youth under 25 years Correlation Summary
| Measurement | Cherokee | Black/African American |
| Minimum | 2.1% | 10.1% |
| Maximum | 45.4% | 41.8% |
| Range | 43.3% | 31.7% |
| Mean | 14.2% | 16.9% |
| Median | 12.2% | 15.9% |
| Interquartile 25% (IQ1) | 8.8% | 12.2% |
| Interquartile 75% (IQ3) | 17.1% | 19.6% |
| Interquartile Range (IQR) | 8.3% | 7.4% |
| Standard Deviation (Sample) | 7.9% | 5.8% |
| Standard Deviation (Population) | 7.8% | 5.8% |
Similar Demographics by Unemployment Among Youth under 25 years
Demographics Similar to Cherokee by Unemployment Among Youth under 25 years
In terms of unemployment among youth under 25 years, the demographic groups most similar to Cherokee are Immigrants from Colombia (11.8%, a difference of 0.020%), Korean (11.7%, a difference of 0.16%), Arab (11.8%, a difference of 0.20%), Egyptian (11.7%, a difference of 0.32%), and Paraguayan (11.7%, a difference of 0.33%).
| Demographics | Rating | Rank | Unemployment Among Youth under 25 years |
| Cypriots | 28.5 /100 | #191 | Fair 11.7% |
| Immigrants | Russia | 28.5 /100 | #192 | Fair 11.7% |
| Seminole | 27.9 /100 | #193 | Fair 11.7% |
| Immigrants | Sri Lanka | 27.8 /100 | #194 | Fair 11.7% |
| Paraguayans | 27.2 /100 | #195 | Fair 11.7% |
| Egyptians | 26.9 /100 | #196 | Fair 11.7% |
| Koreans | 23.9 /100 | #197 | Fair 11.7% |
| Cherokee | 21.2 /100 | #198 | Fair 11.8% |
| Immigrants | Colombia | 20.9 /100 | #199 | Fair 11.8% |
| Arabs | 18.0 /100 | #200 | Poor 11.8% |
| Palestinians | 16.0 /100 | #201 | Poor 11.8% |
| Marshallese | 15.8 /100 | #202 | Poor 11.8% |
| Immigrants | Peru | 15.3 /100 | #203 | Poor 11.8% |
| Immigrants | Costa Rica | 15.2 /100 | #204 | Poor 11.8% |
| Peruvians | 14.0 /100 | #205 | Poor 11.8% |
Demographics Similar to Blacks/African Americans by Unemployment Among Youth under 25 years
In terms of unemployment among youth under 25 years, the demographic groups most similar to Blacks/African Americans are Native/Alaskan (14.5%, a difference of 0.090%), Sioux (14.4%, a difference of 0.51%), Jamaican (14.4%, a difference of 0.63%), Immigrants from Armenia (14.4%, a difference of 0.71%), and Immigrants from Dominica (14.6%, a difference of 0.72%).
| Demographics | Rating | Rank | Unemployment Among Youth under 25 years |
| Immigrants | West Indies | 0.0 /100 | #310 | Tragic 14.2% |
| Immigrants | Bangladesh | 0.0 /100 | #311 | Tragic 14.2% |
| Vietnamese | 0.0 /100 | #312 | Tragic 14.3% |
| Immigrants | Armenia | 0.0 /100 | #313 | Tragic 14.4% |
| Jamaicans | 0.0 /100 | #314 | Tragic 14.4% |
| Sioux | 0.0 /100 | #315 | Tragic 14.4% |
| Natives/Alaskans | 0.0 /100 | #316 | Tragic 14.5% |
| Blacks/African Americans | 0.0 /100 | #317 | Tragic 14.5% |
| Immigrants | Dominica | 0.0 /100 | #318 | Tragic 14.6% |
| West Indians | 0.0 /100 | #319 | Tragic 14.6% |
| Barbadians | 0.0 /100 | #320 | Tragic 14.6% |
| Cheyenne | 0.0 /100 | #321 | Tragic 14.6% |
| Trinidadians and Tobagonians | 0.0 /100 | #322 | Tragic 14.6% |
| Immigrants | Trinidad and Tobago | 0.0 /100 | #323 | Tragic 14.6% |
| Immigrants | Jamaica | 0.0 /100 | #324 | Tragic 14.8% |