Central American Indian vs Sudanese Cognitive Disability
COMPARE
Central American Indian
Sudanese
Cognitive Disability
Cognitive Disability Comparison
Central American Indians
Sudanese
18.2%
COGNITIVE DISABILITY
0.1/ 100
METRIC RATING
293rd/ 347
METRIC RANK
18.9%
COGNITIVE DISABILITY
0.0/ 100
METRIC RATING
334th/ 347
METRIC RANK
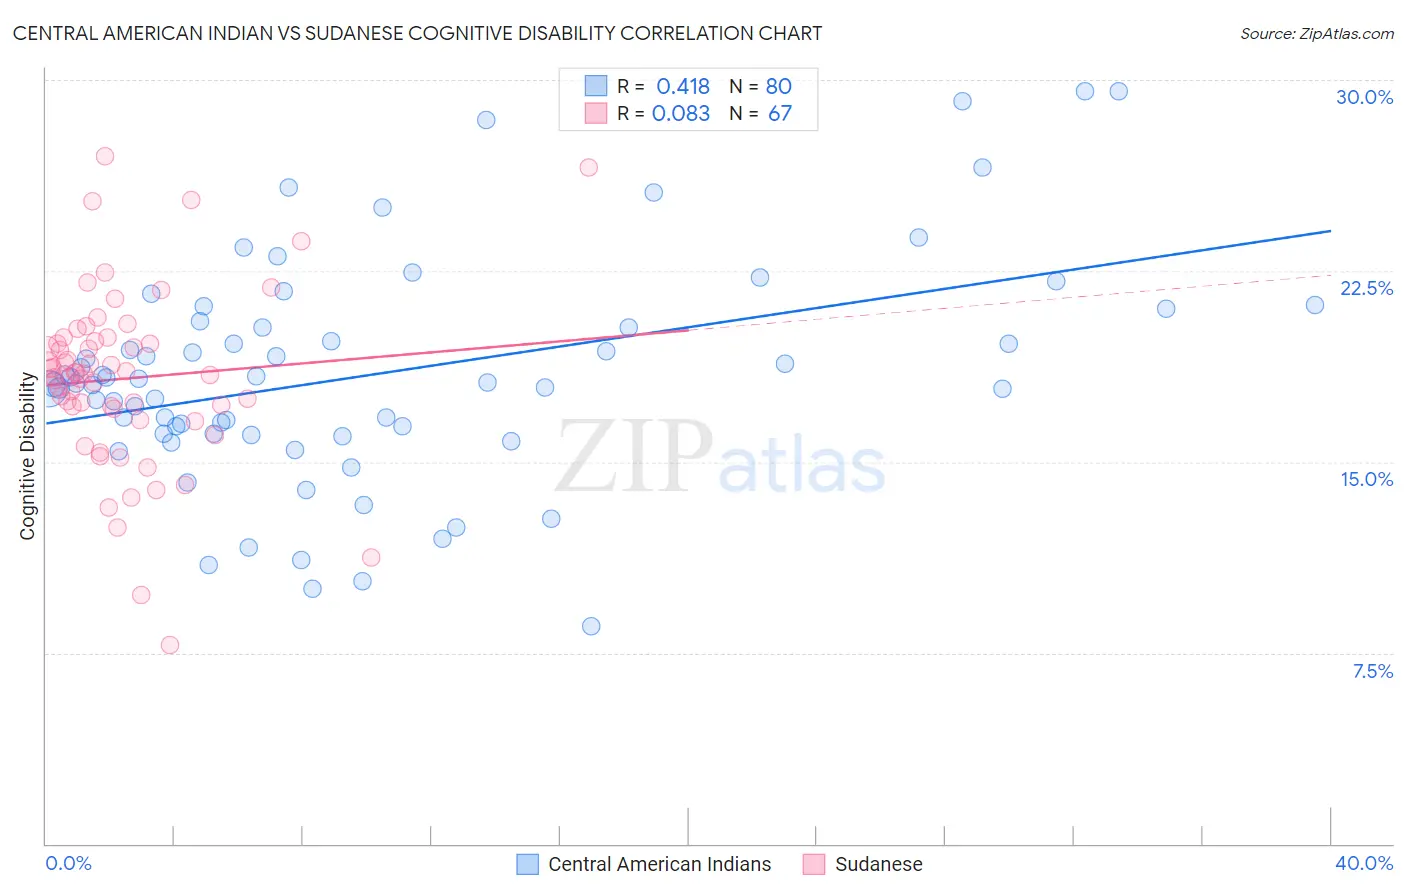
Central American Indian vs Sudanese Cognitive Disability Correlation Chart
The statistical analysis conducted on geographies consisting of 326,115,408 people shows a moderate positive correlation between the proportion of Central American Indians and percentage of population with cognitive disability in the United States with a correlation coefficient (R) of 0.418 and weighted average of 18.2%. Similarly, the statistical analysis conducted on geographies consisting of 110,121,585 people shows a slight positive correlation between the proportion of Sudanese and percentage of population with cognitive disability in the United States with a correlation coefficient (R) of 0.083 and weighted average of 18.9%, a difference of 3.8%.
Cognitive Disability Correlation Summary
| Measurement | Central American Indian | Sudanese |
| Minimum | 8.5% | 7.8% |
| Maximum | 29.6% | 27.0% |
| Range | 21.0% | 19.2% |
| Mean | 18.4% | 18.3% |
| Median | 18.1% | 18.4% |
| Interquartile 25% (IQ1) | 16.1% | 17.1% |
| Interquartile 75% (IQ3) | 20.4% | 19.7% |
| Interquartile Range (IQR) | 4.3% | 2.7% |
| Standard Deviation (Sample) | 4.4% | 3.5% |
| Standard Deviation (Population) | 4.4% | 3.4% |
Similar Demographics by Cognitive Disability
Demographics Similar to Central American Indians by Cognitive Disability
In terms of cognitive disability, the demographic groups most similar to Central American Indians are Iroquois (18.2%, a difference of 0.010%), British West Indian (18.2%, a difference of 0.070%), Ottawa (18.2%, a difference of 0.080%), Immigrants from Africa (18.1%, a difference of 0.21%), and Native/Alaskan (18.1%, a difference of 0.24%).
| Demographics | Rating | Rank | Cognitive Disability |
| Kenyans | 0.1 /100 | #286 | Tragic 18.1% |
| Dutch West Indians | 0.1 /100 | #287 | Tragic 18.1% |
| Immigrants | West Indies | 0.1 /100 | #288 | Tragic 18.1% |
| Natives/Alaskans | 0.1 /100 | #289 | Tragic 18.1% |
| Immigrants | Africa | 0.1 /100 | #290 | Tragic 18.1% |
| Ottawa | 0.1 /100 | #291 | Tragic 18.2% |
| Iroquois | 0.1 /100 | #292 | Tragic 18.2% |
| Central American Indians | 0.1 /100 | #293 | Tragic 18.2% |
| British West Indians | 0.1 /100 | #294 | Tragic 18.2% |
| German Russians | 0.0 /100 | #295 | Tragic 18.2% |
| Immigrants | Burma/Myanmar | 0.0 /100 | #296 | Tragic 18.2% |
| Blackfeet | 0.0 /100 | #297 | Tragic 18.3% |
| Japanese | 0.0 /100 | #298 | Tragic 18.3% |
| Ghanaians | 0.0 /100 | #299 | Tragic 18.3% |
| Creek | 0.0 /100 | #300 | Tragic 18.3% |
Demographics Similar to Sudanese by Cognitive Disability
In terms of cognitive disability, the demographic groups most similar to Sudanese are Immigrants from Yemen (18.8%, a difference of 0.38%), Immigrants from Sudan (18.8%, a difference of 0.44%), Pima (18.8%, a difference of 0.45%), Immigrants from Dominican Republic (18.8%, a difference of 0.52%), and Senegalese (19.0%, a difference of 0.54%).
| Demographics | Rating | Rank | Cognitive Disability |
| U.S. Virgin Islanders | 0.0 /100 | #327 | Tragic 18.7% |
| Kiowa | 0.0 /100 | #328 | Tragic 18.7% |
| Navajo | 0.0 /100 | #329 | Tragic 18.8% |
| Immigrants | Dominican Republic | 0.0 /100 | #330 | Tragic 18.8% |
| Pima | 0.0 /100 | #331 | Tragic 18.8% |
| Immigrants | Sudan | 0.0 /100 | #332 | Tragic 18.8% |
| Immigrants | Yemen | 0.0 /100 | #333 | Tragic 18.8% |
| Sudanese | 0.0 /100 | #334 | Tragic 18.9% |
| Senegalese | 0.0 /100 | #335 | Tragic 19.0% |
| Blacks/African Americans | 0.0 /100 | #336 | Tragic 19.0% |
| Immigrants | Saudi Arabia | 0.0 /100 | #337 | Tragic 19.1% |
| Lumbee | 0.0 /100 | #338 | Tragic 19.1% |
| Puerto Ricans | 0.0 /100 | #339 | Tragic 19.2% |
| Cape Verdeans | 0.0 /100 | #340 | Tragic 19.2% |
| Tohono O'odham | 0.0 /100 | #341 | Tragic 19.3% |