Bermudan vs Sudanese Householder Income Over 65 years
COMPARE
Bermudan
Sudanese
Householder Income Over 65 years
Householder Income Over 65 years Comparison
Bermudans
Sudanese
$58,171
HOUSEHOLDER INCOME OVER 65 YEARS
5.1/ 100
METRIC RATING
224th/ 347
METRIC RANK
$58,281
HOUSEHOLDER INCOME OVER 65 YEARS
5.7/ 100
METRIC RATING
217th/ 347
METRIC RANK
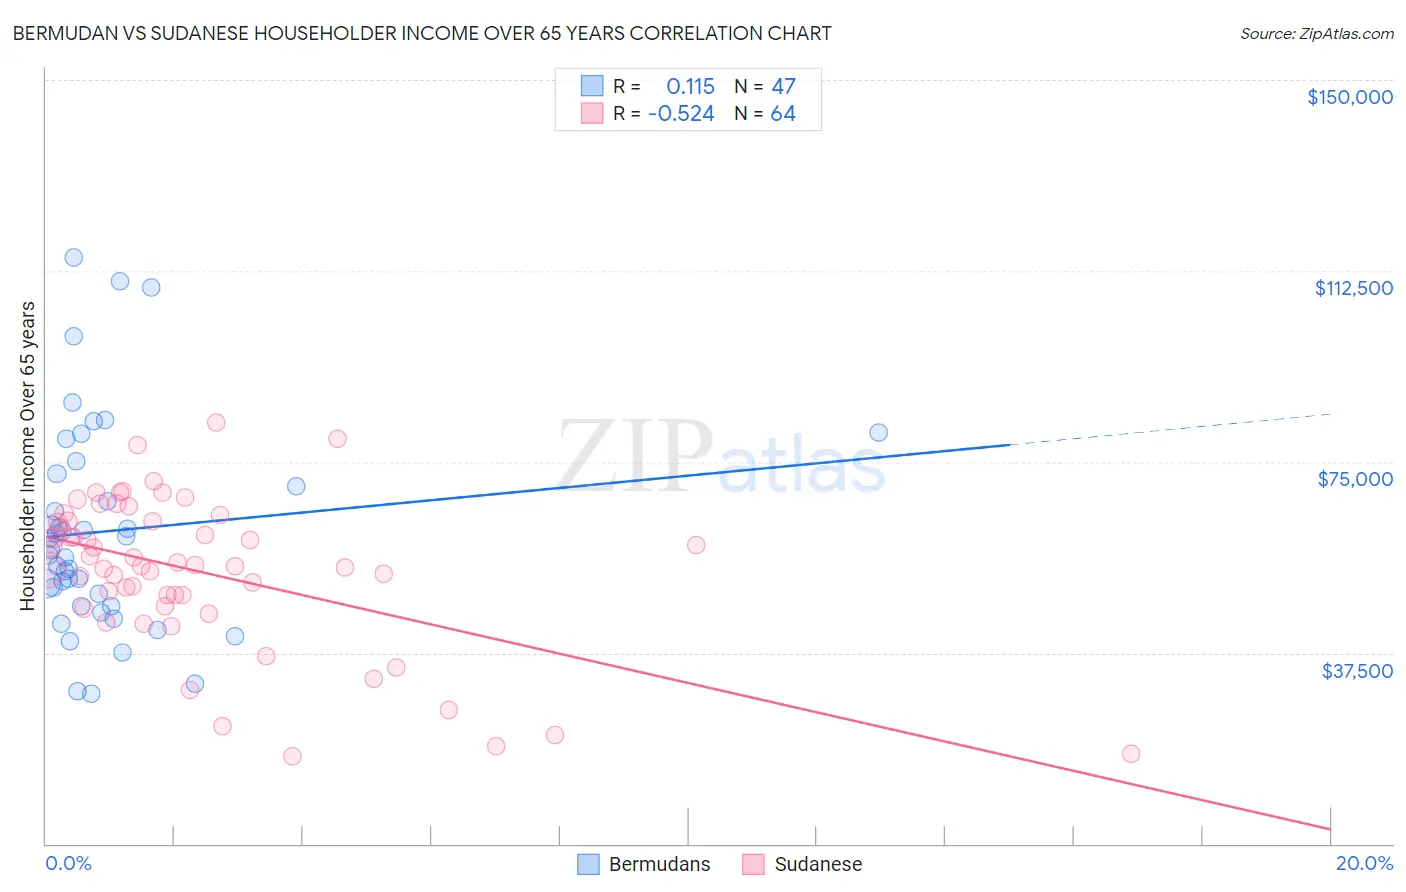
Bermudan vs Sudanese Householder Income Over 65 years Correlation Chart
The statistical analysis conducted on geographies consisting of 55,673,391 people shows a poor positive correlation between the proportion of Bermudans and household income with householder over the age of 65 in the United States with a correlation coefficient (R) of 0.115 and weighted average of $58,171. Similarly, the statistical analysis conducted on geographies consisting of 109,968,006 people shows a substantial negative correlation between the proportion of Sudanese and household income with householder over the age of 65 in the United States with a correlation coefficient (R) of -0.524 and weighted average of $58,281, a difference of 0.19%.
Householder Income Over 65 years Correlation Summary
| Measurement | Bermudan | Sudanese |
| Minimum | $29,369 | $17,083 |
| Maximum | $115,179 | $82,774 |
| Range | $85,810 | $65,691 |
| Mean | $61,411 | $53,447 |
| Median | $57,809 | $54,692 |
| Interquartile 25% (IQ1) | $46,689 | $47,752 |
| Interquartile 75% (IQ3) | $72,720 | $63,414 |
| Interquartile Range (IQR) | $26,031 | $15,662 |
| Standard Deviation (Sample) | $20,368 | $14,913 |
| Standard Deviation (Population) | $20,150 | $14,796 |
Demographics Similar to Bermudans and Sudanese by Householder Income Over 65 years
In terms of householder income over 65 years, the demographic groups most similar to Bermudans are Tsimshian ($58,202, a difference of 0.050%), Delaware ($58,214, a difference of 0.080%), Immigrants from El Salvador ($58,226, a difference of 0.10%), Yugoslavian ($58,243, a difference of 0.12%), and Malaysian ($58,244, a difference of 0.13%). Similarly, the demographic groups most similar to Sudanese are Panamanian ($58,266, a difference of 0.030%), Malaysian ($58,244, a difference of 0.060%), Yugoslavian ($58,243, a difference of 0.070%), Immigrants from El Salvador ($58,226, a difference of 0.10%), and Delaware ($58,214, a difference of 0.11%).
| Demographics | Rating | Rank | Householder Income Over 65 years |
| Nigerians | 11.2 /100 | #210 | Poor $58,992 |
| Immigrants | Nigeria | 10.7 /100 | #211 | Poor $58,942 |
| Colombians | 9.8 /100 | #212 | Tragic $58,851 |
| Whites/Caucasians | 9.8 /100 | #213 | Tragic $58,847 |
| Nepalese | 9.0 /100 | #214 | Tragic $58,761 |
| Immigrants | Ghana | 7.9 /100 | #215 | Tragic $58,624 |
| Immigrants | Middle Africa | 6.2 /100 | #216 | Tragic $58,375 |
| Sudanese | 5.7 /100 | #217 | Tragic $58,281 |
| Panamanians | 5.6 /100 | #218 | Tragic $58,266 |
| Malaysians | 5.5 /100 | #219 | Tragic $58,244 |
| Yugoslavians | 5.5 /100 | #220 | Tragic $58,243 |
| Immigrants | El Salvador | 5.4 /100 | #221 | Tragic $58,226 |
| Delaware | 5.3 /100 | #222 | Tragic $58,214 |
| Tsimshian | 5.2 /100 | #223 | Tragic $58,202 |
| Bermudans | 5.1 /100 | #224 | Tragic $58,171 |
| Venezuelans | 4.4 /100 | #225 | Tragic $58,026 |
| French Canadians | 4.2 /100 | #226 | Tragic $57,975 |
| Japanese | 3.9 /100 | #227 | Tragic $57,919 |
| Immigrants | Albania | 3.6 /100 | #228 | Tragic $57,828 |
| Immigrants | Colombia | 3.0 /100 | #229 | Tragic $57,658 |
| Immigrants | Cambodia | 2.8 /100 | #230 | Tragic $57,580 |