Cambodian vs South African Householder Income Over 65 years
COMPARE
Cambodian
South African
Householder Income Over 65 years
Householder Income Over 65 years Comparison
Cambodians
South Africans
$66,892
HOUSEHOLDER INCOME OVER 65 YEARS
99.8/ 100
METRIC RATING
46th/ 347
METRIC RANK
$65,652
HOUSEHOLDER INCOME OVER 65 YEARS
99.3/ 100
METRIC RATING
66th/ 347
METRIC RANK
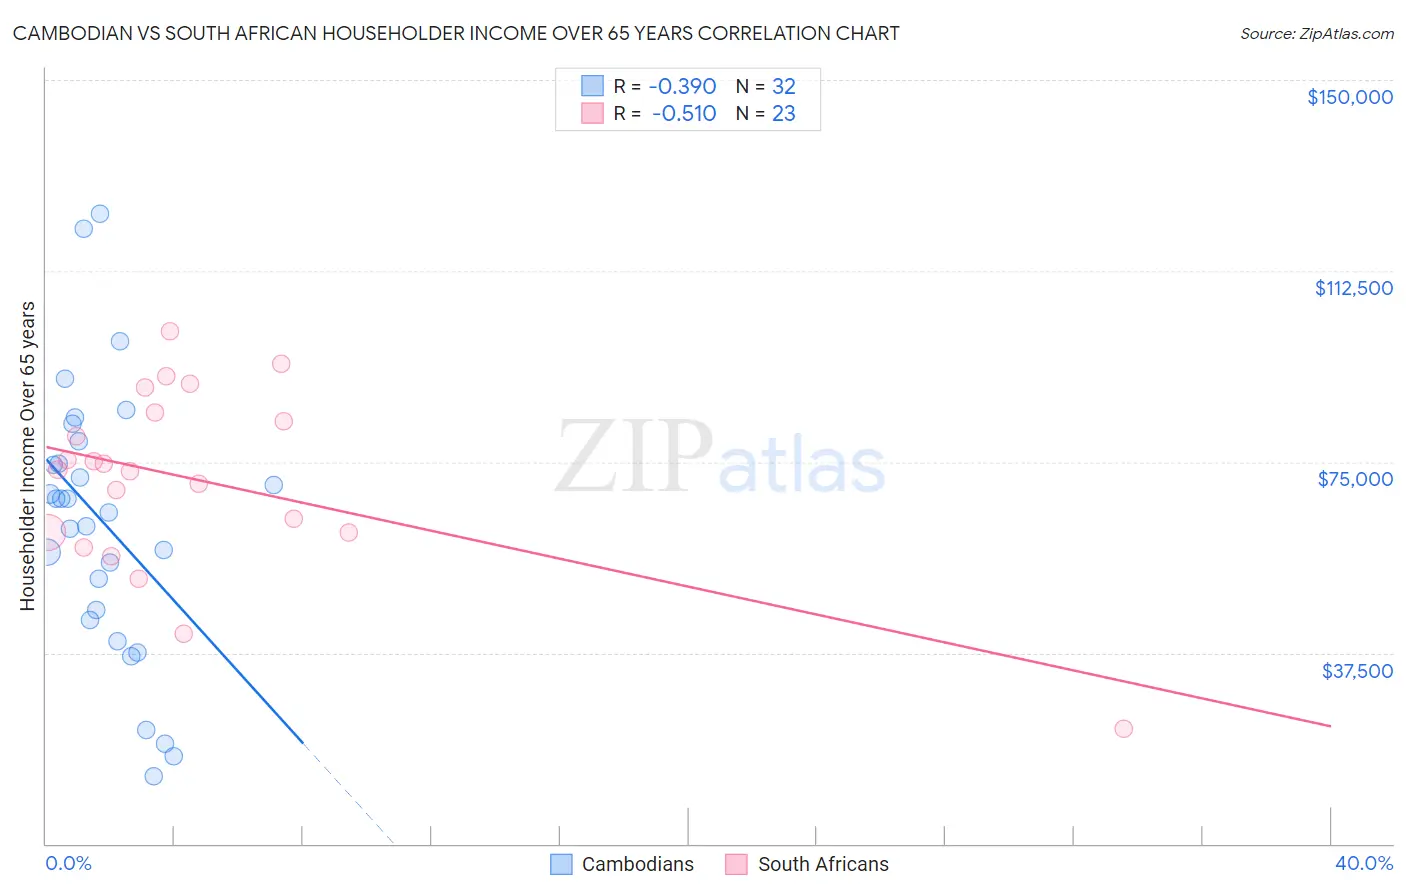
Cambodian vs South African Householder Income Over 65 years Correlation Chart
The statistical analysis conducted on geographies consisting of 102,372,212 people shows a mild negative correlation between the proportion of Cambodians and household income with householder over the age of 65 in the United States with a correlation coefficient (R) of -0.390 and weighted average of $66,892. Similarly, the statistical analysis conducted on geographies consisting of 182,279,663 people shows a substantial negative correlation between the proportion of South Africans and household income with householder over the age of 65 in the United States with a correlation coefficient (R) of -0.510 and weighted average of $65,652, a difference of 1.9%.
Householder Income Over 65 years Correlation Summary
| Measurement | Cambodian | South African |
| Minimum | $13,250 | $22,500 |
| Maximum | $123,750 | $100,655 |
| Range | $110,500 | $78,155 |
| Mean | $63,009 | $71,429 |
| Median | $66,420 | $73,431 |
| Interquartile 25% (IQ1) | $44,945 | $61,016 |
| Interquartile 75% (IQ3) | $76,799 | $84,692 |
| Interquartile Range (IQR) | $31,853 | $23,677 |
| Standard Deviation (Sample) | $26,681 | $18,184 |
| Standard Deviation (Population) | $26,261 | $17,784 |
Demographics Similar to Cambodians and South Africans by Householder Income Over 65 years
In terms of householder income over 65 years, the demographic groups most similar to Cambodians are Australian ($66,891, a difference of 0.0%), Immigrants from France ($66,826, a difference of 0.10%), Immigrants from Indonesia ($66,694, a difference of 0.30%), Immigrants from Turkey ($66,672, a difference of 0.33%), and Israeli ($66,636, a difference of 0.39%). Similarly, the demographic groups most similar to South Africans are Immigrants from England ($65,715, a difference of 0.10%), Zimbabwean ($65,854, a difference of 0.31%), Marshallese ($65,874, a difference of 0.34%), Immigrants from Sierra Leone ($66,009, a difference of 0.54%), and Maltese ($66,027, a difference of 0.57%).
| Demographics | Rating | Rank | Householder Income Over 65 years |
| Cambodians | 99.8 /100 | #46 | Exceptional $66,892 |
| Australians | 99.8 /100 | #47 | Exceptional $66,891 |
| Immigrants | France | 99.8 /100 | #48 | Exceptional $66,826 |
| Immigrants | Indonesia | 99.8 /100 | #49 | Exceptional $66,694 |
| Immigrants | Turkey | 99.7 /100 | #50 | Exceptional $66,672 |
| Israelis | 99.7 /100 | #51 | Exceptional $66,636 |
| Immigrants | Scotland | 99.7 /100 | #52 | Exceptional $66,620 |
| Immigrants | Pakistan | 99.7 /100 | #53 | Exceptional $66,617 |
| Immigrants | Netherlands | 99.7 /100 | #54 | Exceptional $66,463 |
| Immigrants | Czechoslovakia | 99.7 /100 | #55 | Exceptional $66,376 |
| Laotians | 99.6 /100 | #56 | Exceptional $66,306 |
| Bulgarians | 99.6 /100 | #57 | Exceptional $66,236 |
| Immigrants | Philippines | 99.6 /100 | #58 | Exceptional $66,161 |
| Immigrants | Norway | 99.5 /100 | #59 | Exceptional $66,118 |
| Immigrants | Lithuania | 99.5 /100 | #60 | Exceptional $66,087 |
| Maltese | 99.5 /100 | #61 | Exceptional $66,027 |
| Immigrants | Sierra Leone | 99.5 /100 | #62 | Exceptional $66,009 |
| Marshallese | 99.4 /100 | #63 | Exceptional $65,874 |
| Zimbabweans | 99.4 /100 | #64 | Exceptional $65,854 |
| Immigrants | England | 99.3 /100 | #65 | Exceptional $65,715 |
| South Africans | 99.3 /100 | #66 | Exceptional $65,652 |