Immigrants from Belgium vs South African Householder Income Over 65 years
COMPARE
Immigrants from Belgium
South African
Householder Income Over 65 years
Householder Income Over 65 years Comparison
Immigrants from Belgium
South Africans
$69,703
HOUSEHOLDER INCOME OVER 65 YEARS
100.0/ 100
METRIC RATING
25th/ 347
METRIC RANK
$65,652
HOUSEHOLDER INCOME OVER 65 YEARS
99.3/ 100
METRIC RATING
66th/ 347
METRIC RANK
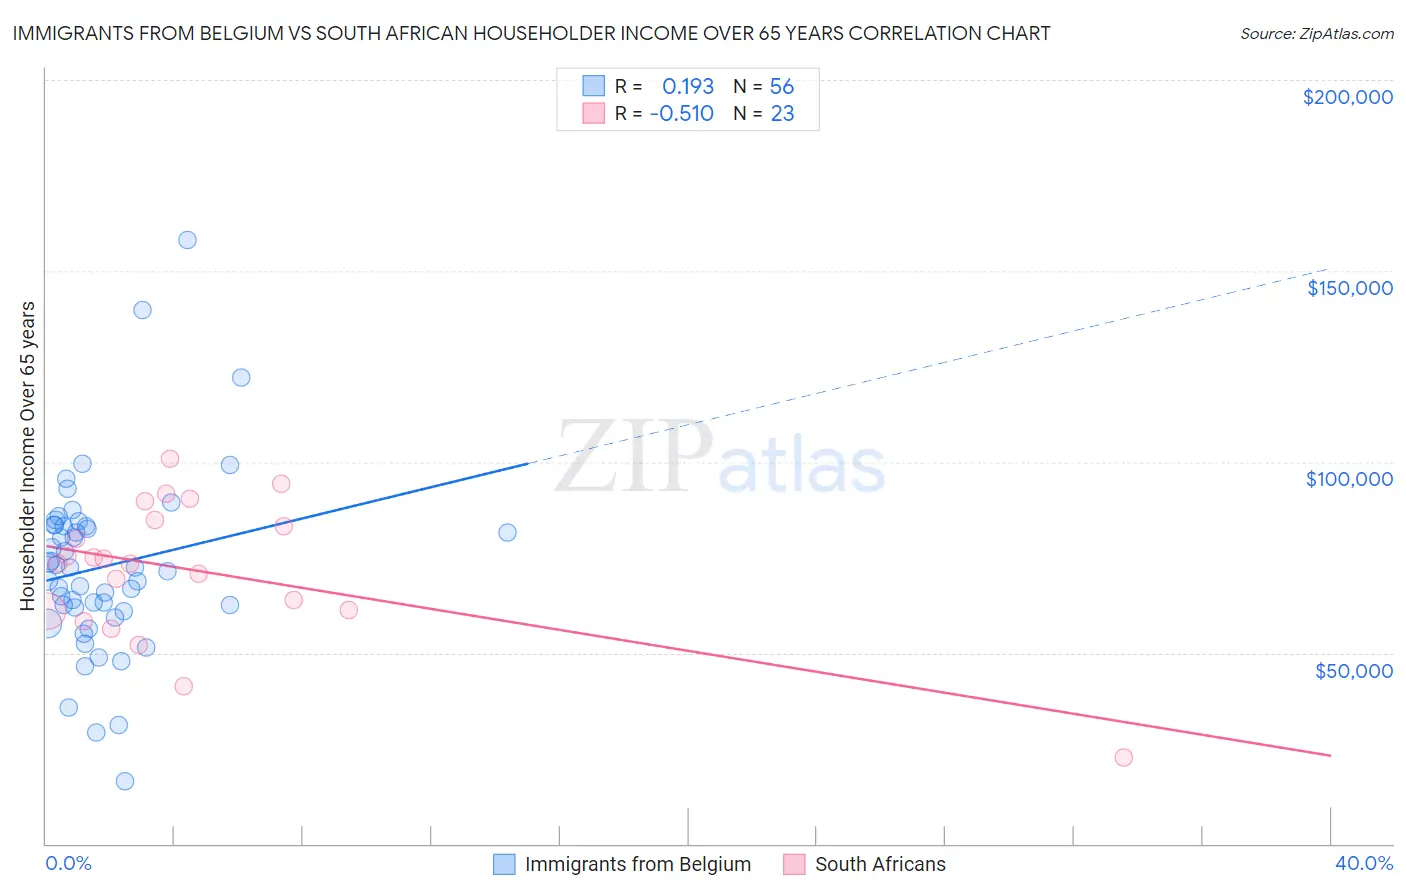
Immigrants from Belgium vs South African Householder Income Over 65 years Correlation Chart
The statistical analysis conducted on geographies consisting of 146,537,349 people shows a poor positive correlation between the proportion of Immigrants from Belgium and household income with householder over the age of 65 in the United States with a correlation coefficient (R) of 0.193 and weighted average of $69,703. Similarly, the statistical analysis conducted on geographies consisting of 182,279,663 people shows a substantial negative correlation between the proportion of South Africans and household income with householder over the age of 65 in the United States with a correlation coefficient (R) of -0.510 and weighted average of $65,652, a difference of 6.2%.
Householder Income Over 65 years Correlation Summary
| Measurement | Immigrants from Belgium | South African |
| Minimum | $16,375 | $22,500 |
| Maximum | $158,214 | $100,655 |
| Range | $141,839 | $78,155 |
| Mean | $72,560 | $71,429 |
| Median | $71,718 | $73,431 |
| Interquartile 25% (IQ1) | $61,443 | $61,016 |
| Interquartile 75% (IQ3) | $83,256 | $84,692 |
| Interquartile Range (IQR) | $21,813 | $23,677 |
| Standard Deviation (Sample) | $23,842 | $18,184 |
| Standard Deviation (Population) | $23,628 | $17,784 |
Similar Demographics by Householder Income Over 65 years
Demographics Similar to Immigrants from Belgium by Householder Income Over 65 years
In terms of householder income over 65 years, the demographic groups most similar to Immigrants from Belgium are Immigrants from Sweden ($69,722, a difference of 0.030%), Immigrants from Japan ($69,774, a difference of 0.10%), Immigrants from Israel ($69,857, a difference of 0.22%), Immigrants from Eastern Asia ($69,872, a difference of 0.24%), and Immigrants from Sri Lanka ($69,426, a difference of 0.40%).
| Demographics | Rating | Rank | Householder Income Over 65 years |
| Eastern Europeans | 100.0 /100 | #18 | Exceptional $70,470 |
| Indians (Asian) | 100.0 /100 | #19 | Exceptional $70,238 |
| Immigrants | South Central Asia | 100.0 /100 | #20 | Exceptional $70,103 |
| Immigrants | Eastern Asia | 100.0 /100 | #21 | Exceptional $69,872 |
| Immigrants | Israel | 100.0 /100 | #22 | Exceptional $69,857 |
| Immigrants | Japan | 100.0 /100 | #23 | Exceptional $69,774 |
| Immigrants | Sweden | 100.0 /100 | #24 | Exceptional $69,722 |
| Immigrants | Belgium | 100.0 /100 | #25 | Exceptional $69,703 |
| Immigrants | Sri Lanka | 100.0 /100 | #26 | Exceptional $69,426 |
| Immigrants | Switzerland | 100.0 /100 | #27 | Exceptional $69,343 |
| Immigrants | China | 100.0 /100 | #28 | Exceptional $69,174 |
| Immigrants | Australia | 100.0 /100 | #29 | Exceptional $69,164 |
| Immigrants | Northern Europe | 100.0 /100 | #30 | Exceptional $69,003 |
| Afghans | 100.0 /100 | #31 | Exceptional $68,951 |
| Asians | 100.0 /100 | #32 | Exceptional $68,822 |
Demographics Similar to South Africans by Householder Income Over 65 years
In terms of householder income over 65 years, the demographic groups most similar to South Africans are Immigrants from England ($65,715, a difference of 0.10%), Immigrants from Malaysia ($65,497, a difference of 0.24%), Zimbabwean ($65,854, a difference of 0.31%), Egyptian ($65,441, a difference of 0.32%), and Marshallese ($65,874, a difference of 0.34%).
| Demographics | Rating | Rank | Householder Income Over 65 years |
| Immigrants | Norway | 99.5 /100 | #59 | Exceptional $66,118 |
| Immigrants | Lithuania | 99.5 /100 | #60 | Exceptional $66,087 |
| Maltese | 99.5 /100 | #61 | Exceptional $66,027 |
| Immigrants | Sierra Leone | 99.5 /100 | #62 | Exceptional $66,009 |
| Marshallese | 99.4 /100 | #63 | Exceptional $65,874 |
| Zimbabweans | 99.4 /100 | #64 | Exceptional $65,854 |
| Immigrants | England | 99.3 /100 | #65 | Exceptional $65,715 |
| South Africans | 99.3 /100 | #66 | Exceptional $65,652 |
| Immigrants | Malaysia | 99.1 /100 | #67 | Exceptional $65,497 |
| Egyptians | 99.1 /100 | #68 | Exceptional $65,441 |
| Samoans | 99.1 /100 | #69 | Exceptional $65,427 |
| Mongolians | 99.0 /100 | #70 | Exceptional $65,326 |
| Greeks | 98.9 /100 | #71 | Exceptional $65,306 |
| Argentineans | 98.9 /100 | #72 | Exceptional $65,246 |
| Immigrants | Ethiopia | 98.9 /100 | #73 | Exceptional $65,238 |