Central American Indian vs Jamaican Median Family Income
COMPARE
Central American Indian
Jamaican
Median Family Income
Median Family Income Comparison
Central American Indians
Jamaicans
$88,034
MEDIAN FAMILY INCOME
0.1/ 100
METRIC RATING
289th/ 347
METRIC RANK
$90,581
MEDIAN FAMILY INCOME
0.2/ 100
METRIC RATING
270th/ 347
METRIC RANK
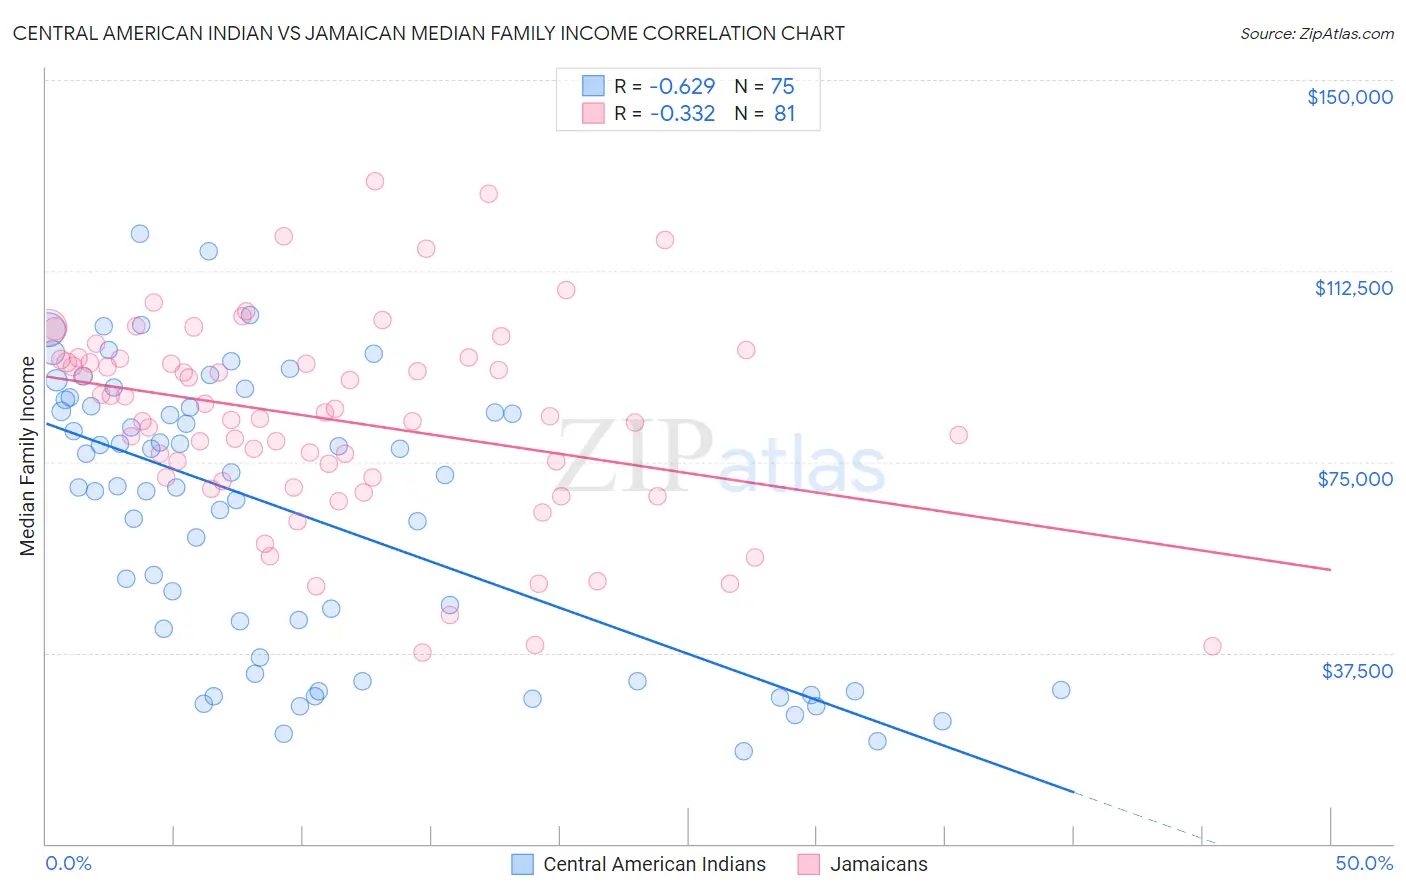
Central American Indian vs Jamaican Median Family Income Correlation Chart
The statistical analysis conducted on geographies consisting of 326,005,427 people shows a significant negative correlation between the proportion of Central American Indians and median family income in the United States with a correlation coefficient (R) of -0.629 and weighted average of $88,034. Similarly, the statistical analysis conducted on geographies consisting of 367,485,053 people shows a mild negative correlation between the proportion of Jamaicans and median family income in the United States with a correlation coefficient (R) of -0.332 and weighted average of $90,581, a difference of 2.9%.
Median Family Income Correlation Summary
| Measurement | Central American Indian | Jamaican |
| Minimum | $18,167 | $37,461 |
| Maximum | $119,681 | $130,066 |
| Range | $101,514 | $92,605 |
| Mean | $65,085 | $83,374 |
| Median | $70,092 | $84,019 |
| Interquartile 25% (IQ1) | $33,434 | $71,528 |
| Interquartile 75% (IQ3) | $85,864 | $95,163 |
| Interquartile Range (IQR) | $52,430 | $23,635 |
| Standard Deviation (Sample) | $27,378 | $19,598 |
| Standard Deviation (Population) | $27,195 | $19,477 |
Demographics Similar to Central American Indians and Jamaicans by Median Family Income
In terms of median family income, the demographic groups most similar to Central American Indians are Cherokee ($88,209, a difference of 0.20%), Immigrants from Nicaragua ($88,267, a difference of 0.26%), Potawatomi ($88,265, a difference of 0.26%), Indonesian ($88,301, a difference of 0.30%), and Guatemalan ($88,295, a difference of 0.30%). Similarly, the demographic groups most similar to Jamaicans are Iroquois ($90,543, a difference of 0.040%), Immigrants from Liberia ($90,450, a difference of 0.14%), Immigrants from Micronesia ($90,345, a difference of 0.26%), Spanish American ($90,322, a difference of 0.29%), and Belizean ($90,880, a difference of 0.33%).
| Demographics | Rating | Rank | Median Family Income |
| Belizeans | 0.2 /100 | #269 | Tragic $90,880 |
| Jamaicans | 0.2 /100 | #270 | Tragic $90,581 |
| Iroquois | 0.2 /100 | #271 | Tragic $90,543 |
| Immigrants | Liberia | 0.2 /100 | #272 | Tragic $90,450 |
| Immigrants | Micronesia | 0.2 /100 | #273 | Tragic $90,345 |
| Spanish Americans | 0.2 /100 | #274 | Tragic $90,322 |
| Immigrants | St. Vincent and the Grenadines | 0.2 /100 | #275 | Tragic $90,094 |
| Immigrants | Zaire | 0.1 /100 | #276 | Tragic $89,285 |
| Immigrants | Jamaica | 0.1 /100 | #277 | Tragic $89,268 |
| Immigrants | Grenada | 0.1 /100 | #278 | Tragic $89,249 |
| Immigrants | Belize | 0.1 /100 | #279 | Tragic $89,197 |
| British West Indians | 0.1 /100 | #280 | Tragic $88,987 |
| Blackfeet | 0.1 /100 | #281 | Tragic $88,717 |
| Comanche | 0.1 /100 | #282 | Tragic $88,556 |
| Bangladeshis | 0.1 /100 | #283 | Tragic $88,358 |
| Indonesians | 0.1 /100 | #284 | Tragic $88,301 |
| Guatemalans | 0.1 /100 | #285 | Tragic $88,295 |
| Immigrants | Nicaragua | 0.1 /100 | #286 | Tragic $88,267 |
| Potawatomi | 0.1 /100 | #287 | Tragic $88,265 |
| Cherokee | 0.1 /100 | #288 | Tragic $88,209 |
| Central American Indians | 0.1 /100 | #289 | Tragic $88,034 |